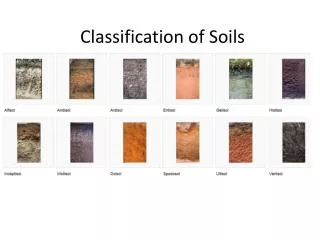
Soil Classification Systems: Engineering Language & Purpose
600 likes | 831 Vues
Discover the importance of soil classification systems in geotechnical engineering, the role they play in determining soil behavior, and how different classification systems are utilized for specific engineering purposes. Explore the limitations of grain-size and textural classification systems and how they impact soil properties.

Soil Classification Systems: Engineering Language & Purpose
E N D
Presentation Transcript
INTRODUCTION • Soil classification is the arrangement of different soils with similar properties into groups and subgroups based on their application. • Soils may be classified in a general way as: • Cohesive vs. cohesionless • Fine- grained vs. coarse grained • Residual vs. Transported • However these terms are too general and cover too wide range of physical and engineering properties. • A more refined classification is necessary to determine the suitability of a soil for specific engineering purposes. • Therefore, these terms are collected into SOIL CLASSIFICATION SYSTEMS, usually with some specific engineering purpose in mind. • A number of classificationsystems have been proposed since the 1st quarter of the 20th century.
Most of the soil classification systems that have been developed for engineering purposes are based on simple index properties such as particle-size distribution and plasticity. NEED FOR SOIL CLASSIFICATION SYSTEMS • A soil classification system represents, in effect, a languageof communication between engineers. • It enables one to use the engineering experience of others. • The engineeringproperties have been found to correlate quite well with the index and classificationproperties of a given soil deposit. • Therefore, by knowing the soil classification, the engineer already has a fairly good generalidea of the way the soil will behave.
Role of Soil Classification in Geotechnical Engineering Classification and index properties (w, e, g , s, GSD, LL, PI, etc.) Classification System “Language” Engineering Properties Permeability, shear strength, compressibility, swell-shrinkage etc. Engineering Purpose (Foundation, Dams, Highways, Airfields, etc.)
Why more than one Classification System are in use? • Classification systems are used to group soils in accordance with their general behavior under givenphysicalconditions. • Soils that are grouped in order of performance for ONE SET of Physical CONDITIONS will not necessarily have the same order for performance under other set of physical conditions. • This led to classifying soil by use, and each agency (Like FAA, AASHTO, USBR) has in mind specific use for the soils.
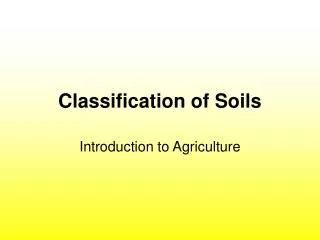
SOIL CLASSIFICATION SYSTEMS 1. Grain-size classification Limitations: • Gives only border between groups (i.e. gravel, sand, silt, clay) but does not give us a name for a given bulk of soil. • In most cases, natural soils are mixtures of particles from several size groups.
2. TEXTURALCLASSIFICATION • In the textural classification system, the soils are named after their principal components, such as sandyclay, siltyclay, and so forth. • The texture of a soil is its appearance or ”feel” and it depends on: • The relative sizes of the particles • Range or distribution of these sizes • Shapes of the particles • Generally the term texture is refereed wholly to the size characteristics of the soil particles. • Large soil particles with some small particles will give COARSE-APPEARNCE or COARSE-TEXTURED soil. • Smaller particles give a MEDIUM TEXTURED soil. • Fine-grained particles give FINE-TEXTURED soil.
A number of textural classification systems were developed in the past by different organizations. • The following figure shows the textural classification system developed by the USDA. It is based on the particle size limit as shown in Table 2.3 in the textbook. Loamissoilcomposed ofsand, silt, andclayin relatively even concentration (about 40-40-20% concentration, respectively).
REMARKS • The chart is based on only the fraction of soils that passes through No. 10 sieve (opening = 2 mm). • If there were no gravel in the soil, the line representing the three sizes included in the chart would intersect at a common point. • If a certain percentage of the soil particles are > 2 mm in diameter, then a correction will be necessary. • In concrete technology called Feret Triangle. • Percentage of each class can be determined from GSD (without GSD, percentage can be determined based on sieve size opening).
Example 1 Let it be desired to determine the textural classification of a soil whose grading is as follows: The two lines intersect within the area labeled LOAM, which is the textural class of this soil. Notes We could have used the point of intersection of: • Silt-size+ Clay-size • Sand-size + Clay-size
Example 2 Let it be desired to determine the textural classification of a soil whose grading is as follows: Find the modified textural composition: The textural classification is CLAY. Because of the large percentage of gravel, it may be called GRAVELLY CLAY.
Limitations of Textural Classification Systems • They are based entirely on particle-size distribution and does not consider PLASTICITY which to great extent influences the physical properties of soils. • Because textural classification systems do not take plasticity into account and are not totally indicative of many important soil properties, they are inadequate for most engineering purposes. • The two elaborate systems used at present are AASHTO and USCS. Both systems take into account the particle-sizedistribution and plasticity. • The AASHTO classification system is used mostly by highwaydepartments. Geotechnicalengineers generally prefer the Unified system.
3. CLASSIFICATION BY USE A. AASHTO CLASSIFICATION SYSTEM • The AASHTO soil classification system was originally developed in the late 1920’s (1929) by the U.S. Bureau of Public Roads (BPR) for the classification of soils for highway subgrade use. • It was developed as a result of the work of Hogentogler in the 1920’s. • Adopted by Bureau of Public Roads in 1931. • AASHTO : Acronym of American Association of State Highway and Transportation Officials. • Originally, the system classified soil as being either a group A or a Group B.
A Group A soil was able to maintain uniform pavement support at all location whereas the Group B soils were not. • The B designation was subsequently deleted, leaving only A soils in the classification system. • Consequently, the “A” still remains in an AASHTO classification of a soil type, but it no longer has any real significance. • The A soils were subdivided into eight subgrade soil groups. A-1 through A-8. • It went through various revisions since 1929, and the classification system received its last revision in 1974. • ASTMD-3282; AASHTO method M145.
Criteria: Tests Required: • Grain-size analysis • Liquid Limit • Plastic Limit
Sieve No. 10 Sieve No. 200 Remarks • In addition to Sieve no. 10 & 200 also sieve no. 40 is involved in AASHTO classification which separates between medium and fine sands. • In the classification, differentiation between silt and clay soils is based on plasticity.
0.075 mm 4.75 mm (USCS) 2.0 mm 0.425 mm Sand Gravel (AASHTO)
3 Groups 6 Subgroups
4 Groups 2 Subgroups
No. 10 No. 40 No. 200 For classification starts apply the test data from left to right, top to bottom. By process of elimination, the first group from the left into which the test data fit is the correct classification.
The plot below is for the range of the liquid limit and the plasticity index for soils that fall into groups A-2, A-4, A-5, A-6, and A-7. • If the soil is A-1 or A-3 we cannot use this chart (mainly non plastic soils). Note: Differentiation between A-2’s and other group is based on %passing Sieve No. 200
REMARKS • According to this system, soil is classified into eight major groups, A-1 through A-8. • Soil group A-8 is peat (very organic) or muck (thin very watery, and with considerable organic material). • A soil is classified according to the table by proceeding from left to right, top to bottom, column by column on the table to find the first group in which the soil test data will fit. • The first group from the left into which the test data will fit is the correct classification. • The classification process stops at this point regardless if another column farther to the right can also qualify.
GROUP INDEX • Soils containing fine-grained material are further identified by a number called GROUP INDEX (GI). This was to establish the relative RANKING of a soil within a subgroup or a group. This help in evaluating the quality of a soil as a highway subgrade material. • It is dependent on: 1. Percentage of the soil passing the No. 200 (0.075 mm) sieve. 2. Liquid limit, LL 3. Plasticity Index, PI • The index is given by the following empirical formula: F200= % passing No. 200 sieve.
Rules for Determining Group Index • If GI is negative value take it as zero. • GI is rounded off to the nearest whole number. • There is no upper limit for GI. • The group index belonging to groups A-1-a, A-1-b, A-2-4, A-2-5 and A-3 will always be zero. Why? • When calculating the group index for soils belonging to groups A-2-6 and A-2-7, the partial group index for PI should be used, or • The group index value is written in parenthesis next to the AASHTO symbol. Ex. A-2-6(3), A- 4(5) etc. • In general the higher the GI, the less desirable is the soil for use as a subgrade. A GI of 0 indicates a “good’ subgrade , and a GI> or equal 20 indicates a “verypoor” subgrade material.
Partial Group Index GI = 0 Full Group Index No. 10 No. 40 No. 200
Example 1 The sieve analysis and plasticity data for two soils are given in the table below. Classify soils according to the AASHTO soil classification system.
No. 10 No. 40 No. 200 Soil 1: A-7-5 GI =(75-35)[0.2+.005(110-40)] +0.01(75-15)[60-10] = 52 Soil 2: A-1-a(0) The soil is A-7-5(52)
Soil 1: A-7-5 110 Because %Passing #200 > 35% The soil is classified as A-7-5 andnot A-2-7.
Because %Passing #200 > 35% The soil is classified as A-7-5 andnot A-2-7. #200 86% LL 70% PI 32%
Example3 The grain size distribution curve, natural water content, liquid limit, and liquidity index are give below. Classify the soil according to the AASHTO Classification System. Solution Given PL =21.25% 40 PI = 18.75%
No. 10 No. 40 No. 200 From the AASHTO Table the soil is classified as:A-2-6 (0)
Because %Passing #200 < 35% The soil is classified as A-2-6 andnot A-6. Note: If the location comes along the border line, we need to consult the table and the grain size will tell the classification of the given soil.
Remarks About AASHTO System • Boulders (retained on 75 mm (3 inch) sieve] should be excluded from the portion of the sample to which the classification is applied, but the percentage of such material, if any, in the sample should be recorded. • Differentiation between A-7-5, A-7-6 is according to the following criterion: PI <= LL- 30 ------A-7-5 PI > LL- 30-------- A-7-6 Or instead we use the chart • Group A-3 is placed before group A-2 in the table since: • It is better as a subgrade • It is based only on grain size So it was easer to put A-3 before A-2 in order to facilitate left to right and top to bottom procedures applied in this system. • For A-1, A-3, A-2-4, A-2-5…>> F<= 35% , PI < 15, therefore GI –ve (i.e. GI always zero).
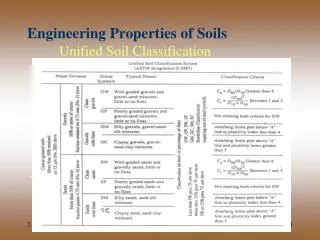
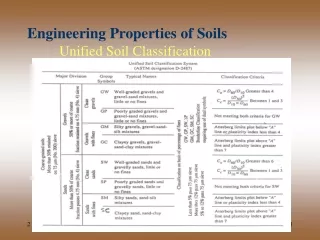
B. UNIFIED SOIL CLASSIFICATION SYSTEM (USCS) • This system was developed by ArthurCasagrande in 1942 for use in the air field construction works undertaken by the Army Corps of Engineers during WWII. • To make it applicable to DAMS and other constructions besides airfields, it was revised in 1952 in cooperation with the USBR. • The system was last revised in 1984 by the ASTM by the addition of a GROUPNAME to the group symbol. This modification has not been adopted by some agencies which use USCS to classify soils. • ASTM Test Designation D-2487.
This system is the mostpopular soil classification system among geotechnicalengineers. • This system classifies soils under three broad categories: • Coarse-grained soils < =50% passes sieve No. 200 • Fine-grained soils > 50% passes sieve No. 200 • Organic • Criteria for USCS: • Grain size • Cu, Cc • Plasticity (Plasticitychart) • Tests required • Grain-size analysis • Liquid Limit • Plastic Limit
All soils are classified into 15 groups each group is designated by two letters called a GROUP SYMBOL. • The first letter of the group symbol is termed the PREFIX and the second letter is termed the SUFFIX. These letters are abbreviations of certain soil characteristics as follows:
Gravels Sands Low Plasticity Use Plasticity Chart High Plasticity
USCS AASHTO Gravels Sands
To determine if well graded (W) or poorly graded (P), calculate Cu and Cc Coefficient of uniformity Coefficient of gradation
B-Line CH CL CL-ML MH ML U-Line or A-Line OH or OL or OH based on the value of a OH or or OH OH
Organic Soils • Organic clay or silt (group symbol OL or OH): • The second symbol is obtained by locating the values of PI and LL (notovendried) in the plasticity chart. • Highly organic soils- Peat (Group symbol Pt) • A sample composed primarily of vegetable tissue in various stages of decomposition and has a fibrous to amorphous texture, a dark-brown to black color, and an organic odor should be designated as a highly organic soil and shall be classified as peat, PT.
B-Line CH % Passing sieve No. 200 Use Cu, Cc W : well graded P: poorly graded GW, GP, SW or SP < 5% CL CL-ML GW-GM, GW-GC, GP-GM, GP-GC, SW-SM, SW-SC, SP-SM, SP-SC 5% -12 % MH Use plasticity charts GM, GC, SM, SC > 12% ML % Passing sieve No. 200 (0.075 mm) < = 50% > 50% Coarse-grained soils (Gravel (G) or Sand (S)) Fine-grained soils (Silt (M) or Clay (C)) % Coarse soil (Co) = 100 - % Passing # 200 % Gravel (G) = 100 - % Passing # 4 A-Line G > 1/2 Co G < 1/2 Co or Sand (S) Gravel (G) OH or OL or OH or OL OL or OH based on the value of a
Example 1 The sieve analysis and plasticity data for two soils are given in the table below. Classify the soils according to the USCS soil classification system. Soil 1: SC MH Soil 2:
Example 2 Classify the following soils Using USCS SC CH SM 47
Example 2 (Cont.) SC CH SM
Example 3 50