Download
1 / 52
540 likes | 586 Vues
Learn about statistical experiments, hypothesis testing, sampling, and more. Understand concepts like point estimation, the central limit theorem, errors in hypothesis testing, and power of statistical tests.

E N D
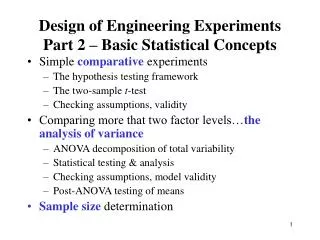
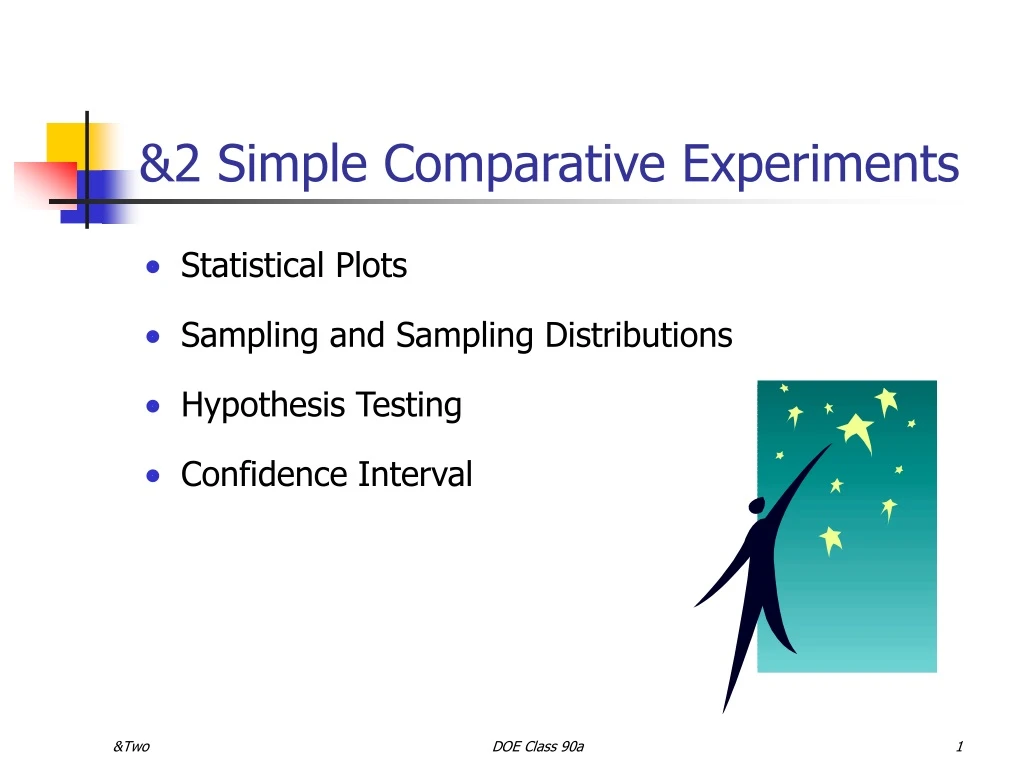
&2 Simple Comparative Experiments • Statistical Plots • Sampling and Sampling Distributions • Hypothesis Testing • Confidence Interval DOE Class 90a
~ 點圖 (Dot Diagram) DOE Class 90a
直方圖 (Histogram) DOE Class 90a
盒形圖 (Box Plot) DOE Class 90a
時間序列圖 (Time Series Plot) DOE Class 90a
期望值與變異數之公式 • 母體平均數(m) = 隨機變數之期望值E(X) • 母體變異數(s2) = 隨機變數之變異數 V(X) DOE Class 90a
期望值與變異數之公式 DOE Class 90a
Sample and Sampling DOE Class 90a
點估計(Point Estimation) • 以抽樣得來之樣本資料, 依循某一公式計算出單一數值, 來估計母體參數, 稱為點估計. • 好的點估計公式之條件: • 不偏性 • 最小變異 • 常用之點估計: • 母體平均數(m) • 母體變異數(s 2) DOE Class 90a
Central Limit Theorem DOE Class 90a
假設檢定(Hypothesis Testing) • “A person is innocent until proven guilty beyond a reasonable doubt.” 在沒有充分證據證明其犯罪之前, 任何人皆是清白的. • 假設檢定 H0: m = 50 cm/s H1: m 50 cm/s • Null Hypothesis (H0) Vs. Alternative Hypothesis (H1) • One-sided and two-sided Hypotheses • A statistical hypothesis is a statement about the parameters of one or more populations. DOE Class 90a
About Testing • Critical Region • Acceptance Region • Critical Values DOE Class 90a
Errors in Hypothesis Testing • 檢定結果可能為 • Type I Error(a): Reject H0 while H0 is true. • Type II Error(b): Fail to reject H0 while H0 is false. DOE Class 90a
Making Conclusions • We always know the risk of rejecting H0, i.e., a, the significant level or the risk. • We therefore do not know the probability of committing a type II error (b). • Two ways of making conclusion: 1. Reject H0 2. Fail to reject H0, (Do not say accept H0) or there is not enough evidence to reject H0. DOE Class 90a
Significant Level (a) • a = P(type I error) = P(reject H0 while H0 is true) n = 10, s = 2.5 s/n = 0.79 DOE Class 90a
The Power of a Statistical Test • Power = 1 - b • Power = the sensitivity of a statistical test DOE Class 90a
General Procedure for Hypothesis Testing 1. From the problem context, identify the parameter of interest. 2. State the null hypothesis, H0. 3. Specify an appropriate alternative hypothesis, H1. 4. Choose a significance level a. 5. State an appropriate test statistic. 6. State the rejection region for the statistic. 7. Compute any necessary sample quantities, substitute these into the equation for the test statistic, and compute that value. 8. Decide whether or not H0 should be rejected and report that in the problem context. DOE Class 90a
Inference on the Mean of a Population-Variance Known • H0: m = m0 H1: m m0 , where m0 is a specified constant. • Sample mean is the unbiased point estimator for population mean. DOE Class 90a
Example 8-2 Aircrew escape systems are powered by a solid propellant. The burning rate of this propellant is an important product characteristic. Specifications require that the mean burning rate must be 50 cm/s. We know that the standard deviation of burning rate is 2 cm/s. The experimenter decides to specify a type I error probability or significance level of α = 0.05. He selects a random sample of n = 25 and obtains a sample average of the burning rate of x = 51.3 cm/s. What conclusions should be drawn? DOE Class 90a
The parameter of interest is m, the meaning burning rate. • H0: m = 50 cm/s • H1: m 50 cm/s • a = 0.05 • The test statistics is: • Reject H0 if Z0 > 1.96 or Z0 < -1.96 (because Za/2 = Z0.025 = 1.96) • Computations: • Conclusions: Since Z0 = 3.25 > 1.96, we reject H0: m = 50 at the 0.05 level of significance. We conclude that the mean burning rate differs from 50 cm/s, based on a sample of 25 measurements. In fact, there is string evidence that the mean burning rate exceeds 50 cm/s. DOE Class 90a
P-Values in Hypothesis Tests • Where Z0 is the test statistic, and (z) is the standard normal cumulative function. DOE Class 90a
The Sample Size (I) • Given values of a and d, find the required sample size n to achieve a particular level of b.. DOE Class 90a
The Operating Characteristic Curves- Normal test (z-test) • Use to performing sample size or type II error calculations. • The parameter d is defined as: so that it can be used for all problems regardless of the values of m0 and s. • 課本41頁之公式為兩平均數差之假設檢定所需之樣本數公式。 DOE Class 90a
Construction of the C.I. • From Central Limit Theory, • Use standardization and the properties of Z, DOE Class 90a
Inference on the Mean of a Population-Variance Unknown • Let X1, X2, …, Xn be a random sample for a normal distribution with unknown mean m and unknown variance s2. The quantity has a t distribution with n - 1 degrees of freedom. DOE Class 90a
Inference on the Mean of a Population-Variance Unknown • H0: m = m0 H1: m m0 , where m0 is a specified constant. • Variance unknown, therefore, use s instead of s in the test statistic. • If n is large enough ( 30), we can use Z-test. However, n is usually small. In this case, T0 will not follow the standard normal distribution. DOE Class 90a
Inference for the Difference in Means-Two Normal Distributions andVariance Unknown • Why? DOE Class 90a
is distributed approximately as t with degrees of freedom given by DOE Class 90a
C.I. on the Difference in Means DOE Class 90a
C.I. on the Difference in Means DOE Class 90a
Paired t-Test • When the observations on the two populations of interest are collected in pairs. • Let (X11, X21), (X12, X22), …, (X1n, X2n) be a set of n paired observations, in which X1j~(m1, s12) and X2j~(m2, s22) and Dj = X1j – X2j, j = 1, 2, …, n. Then, to test H0: m1= m2 is the same as performing a one-sample t-test H0: mD = 0 since mD = E(X1-X2) = E(X1)-E(X2) = m1 - m2 DOE Class 90a
Inference on the Variance of a Normal Population (I) • H0: s2 = s02 H1: s2 s02 , where s02 is a specified constant. • Sampling from a normal distribution with unknown mean m and unknown variance s2, the quantity has a Chi-square distribution with n-1 degrees of freedom. That is, DOE Class 90a
Inference on the Variance of a Normal Population (II) • Let X1, X2, …, Xn be a random sample for a normal distribution with unknown mean m and unknown variance s2. To test the hypothesis H0: s2 = s02 H1: s2 s02 , where s02 is a specified constant. We use the statistic • If H0 is true, then the statistic has a chi-square distribution with n-1 d.f.. DOE Class 90a
The Reasoning • For H0 to be true, the value of 02 can not be too large or too small. • What values of 02 should we reject H0? (based on a value) What values of 02 should we conclude that there is not enough evidence to reject H0? DOE Class 90a
Example 8-11 An automatic filling machine is used to fill bottles with liquid detergent. A random sample of 20 bottles results in a sample variance of fill volume of s2 = 0.0153 (fluid ounces)2. If the variance of fill volume exceeds 0.01 (fluid ounces)2, an unacceptable proportion of bottles will be underfilled and overfilled. Is there evidence in the sample data to suggest that the manufacturer has a problem with underfilled and overfilled bottles? Use a = 0.05, and assume that fill volume has a normal distribution. DOE Class 90a
1. The parameter of interest is the population variance s2. 2. H0: s2 = 0.01 3. H1: s2 0.01 4. a = 0.05 5. The test statistics is 6. Reject H0 if 7. Computations: 8. Conclusions: Since , we conclude that there is no strong evidence that the variance of fill volume exceeds 0.01 (fluid ounces)2. DOE Class 90a
Hypothesis Testing on Variance - Normal Population DOE Class 90a
The Test Procedure for Two Variances Comparison DOE Class 90a