Download
1 / 72
720 likes | 736 Vues
A comprehensive outline of the history, traditional sources of energy, current and projected energy production, and renewable energy resources. Debunking myths and distortions surrounding renewable energy.

E N D
Powered by the SUN:Renewable Energy Myths, Distortions and Reality
Outlines • History • Traditional Sources of Energy • Current and Projected Energy Production • Renewable Energy Resources • Discussion and Evaluation
History Pearl Street station 1882 First commercial station 1882 - Built by Thomas Edison - Operated on DC current - Started with 59 customers! - Cost: 24¢/KWh - Operated on coal - Operated at night only until 1889 A sketch of the exterior of the Pearl Street station. Courtesy: Photographic Services of the Consolidated Edison Company of New York, Inc.
The First Commercial Station • Each “jumbo dynamo” produced 100 KW power enough to power 1200 light bulbs • 6 dynamos were installed in the station to light up 1 square mile in New York City. 27-ton “Jumbo” dynamo Edison's Jumbo dynamo. Courtesy: National Park Service, Edison National Historic Site.
Power Generation (a) A 2-pole machine has one N and one S pole on the rotor and on the stator. (b) A 4-pole machine has 4 poles on the rotor and 4 on the stator. Renewable and efficient electric power systems / Gilbert M. Masters, 2004, John Wiley & Sons, Inc.,
Fossil fuel, steam-electric power plant Traditional Power sources Renewable and efficient electric power systems / Gilbert M. Masters, 2004 by John Wiley & Sons, Inc.,
Coal plant Reality The pictures you see Traditional Power sources
Coal Power Mass flows to generate 1 kWh of electricity in a 33.3% efficient, coal-fired power plant burning bituminous coal
Fossil Fuel-Fired Power Plants • Burn coal heat water steam turn the turbine • 500 plants currently in operation • Three types: • Pulverized Coal plants: – burn coal only - most polluting, ~ 37-38% efficiency • Fluidized Bed plant: – burn coal, biomass, waste, tires, other fuel. 40 to 50% efficiency. • Integrated Gasification Combined Cycle (IGCC) plants: burn syngas (synthetic gas, extracted from coal and other organic materials). 60% efficiency. more expensive. • There is no such thing as clean coal!
Environmental Cost For each megawatt-hour from a coal plant: • 2,249 lbs of carbon dioxide, • 13 lbs of sulfur dioxide, and • 6 lbs of nitrogen oxide • Traces of mercury (Hg) • > 140 other chemicals classified as “hazardous air pollutants” by the EPA
Stop: Greenhouse gases are good! • The Earth average temperature is 15o while the Moon’s average temperature is -18o • Both objects are within similar distance from the sun • The question is how much is released? • Are we tipping the balance
Nuclear Power Two types: 1. The Boiling Water Reactor (BWR) 2. The Pressurized Water Reactor (PWR) Traditional Power sources
The Boiling Water Reactor (BWR) Traditional Power sources Boiling Water Reactors 200 MeV
The Boiling Water Reactor (BWR) Operating Efficiency = 32% The Boiling Water Reactor (BWR) Pressure =70 atmosphere H2O boiling T= 285 oC Traditional Power sources BWRs actually boil the water. Water is converted to steam, and then recycled back into water by a part called the condenser, to be used again in the heat process.
The Pressurized Water Reactor (PWR) The Pressurized Water Reactor (PWR) Pressure =160 atmosphere H2O boiling T= 315 oC
Nuclear Plants Positives • CO2 emissions are minimal • The power produced by the world's nuclear plants would normally produce 2 billon metric tons of CO2 per year if they depended on fossil fuels Negatives • Annually generates 20 metric tons of used high-level radioactive nuclear waste. Over 2,000 metric tons produced yearly world wide. • The waste emits radiation and heat, meaning that it will eventually corrode any container and can prove lethal to nearby life forms • It takes tens of thousands of years for the waste to reach safe radioactive levels • The waste has to be maintained, monitored and guarded to prevent the materials from falling into the wrong hands. All of these services and added materials cost money -- on top of the high costs required to build a plant. U-235 halflife = 700 million years U-238 halflife = 4.5 billion years
Nuclear Plants • Investment $2.5 to 4 Billion • Investment recovery time: 25 to 40 years • ~ One decade to plan • Federal new nuclear generation tax credit: $1 billion per first Gegawatt of power
World Total Electricity Net Generation (Terawatthours) Electrical Generation Energy Information Administration (EIA)-US Government
World Generation Percentage Electrical Generation Energy Information Administration (EIA)-US Government
North America ProjectionPower Generation 2008 Energy Information Administration (EIA)-US Government
The Role of Renewable Energy Consumption in the Nation’s Energy Supply, 2007 Total Energy Consumption Energy Information Administration (EIA)-US Government
Note the start of coal contribution and petroleum contribution (cars) Marland, G., T.A. Boden, and R. J. Andres. 2003. "Global, Regional, and National CO2 Emissions." In Trends: A Compendium of Data on Global Change. Carbon Dioxide Information Analysis Center, Oak Ridge National Laboratory, U.S. Department of Energy, Oak Ridge, Tenn., U.S.A. http://cdiac.esd.ornl.gov/trends/emis/tre_glob.htm]
Note the change in Europe’s contribution Mostly due environmental policies Carbon Dioxide Information Analysis Center (CDIAC)
Obsession With Fossil CNN News Feb. 1, 2009: Exxon shatters profit records Oil giant makes corporate history by booking $11.7 billion in quarterly profit; earns $1,300 a second in 2007. This is during recession!!!
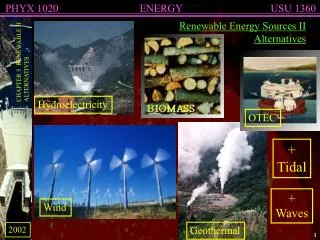
Renewable Sources Sources: 1. Hydroelectric 2. Geothermal 3. Ocean/Tides 4. Wind 5. Biomass 6. Solar
HydroelectricOldest Renewable Source • No fuel combustion • Minimal air pollution compared to fossil fuel plants • limited thermal pollution compared with nuclear plants Like other energy sources, the use of water for generation has limitations, including environmental impacts caused by damming rivers and streams, which affects the habitats of the local plant, fish, and animal life.
Hydroelectric Photo courtesy U.S. Bureau of ReclamationThe shaft that connects the turbine and generator Photo courtesy U.S. Bureau of ReclamationThe giant generators at Hoover Dam produce more than 2,000 megawatts. http://ga.water.usgs.gov/edu/hyhowworks.html
Hydroelectric fun Photo courtesy U.S. Patent and Trademark OfficeImage from patent No. 6,239,501: Footwear with hydroelectric generator assembly
Geothermal • The center of the earth is approximately 4000 degrees Celsius • Geothermal energy is contained in underground reservoirs of steam, hot water, and hot dry rocks ~10000 ft
Biomass Three Main Sources: • Wood - Direct use of wood - Wood waste: • Waste: • Municipal solid waste, • recycling, composting, landfilling, and waste-to-energy via incineration - manufacturing waste - landfill gas • Alcohol fuels Mostly from Corn
Municipal solid waste Wood and wood waste Landfill gas
SolarThermal • Solar thermal: - from heating swimming pools to creating steam for electricity generation Heating only Stirling Energy Systems, Inc. (SES)/Boeing, 25 kW Dish Stirling system at sunset
Solar thermal Ausra claims that a land footprint of 9,600 square miles, about 1% of US deserts is needed to power the whole USA.
How Much Area for Thermal Solar how much land would be needed to power the world, Europe or Germany with solar-thermal power Spiegel Online
Conventional Plot of the Sun’s radiation http://en.wikipedia.org/wiki/Image:Solar_Spectrum.png
Conventional Plot of the Sun’s radiation Note the change in the coordinates
A New Look at the Sun’s radiation Number of photons is a major factor