Download
1 / 1
10 likes | 132 Vues
Diagnosis of Summer Hydroclimate Variability over North America in 20 th Century Climate Simulations By Alfredo Ruiz-Barradas 1 ,and Sumant Nigam University of Maryland ~~~~~o~~~~~ Honolulu, Hawaii March 1-4, 2005. Meteorology. 1 alfredo@atmos.umd.edu. Abstract

E N D
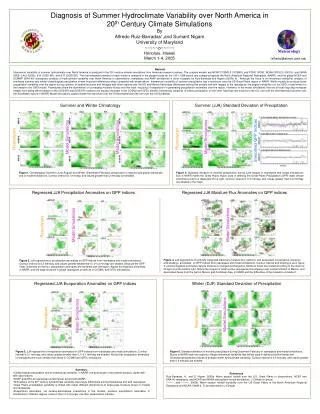
Diagnosis of Summer Hydroclimate Variability over North America in 20th Century Climate Simulations By Alfredo Ruiz-Barradas1,and Sumant Nigam University of Maryland ~~~~~o~~~~~ Honolulu, Hawaii March 1-4, 2005 Meteorology 1alfredo@atmos.umd.edu Abstract Interannual variability of summer hydroclimate over North America is analyzed in the 20th century climate simulations from American research centers. The coupled models are NCAR CCSM3.0 (CCSM3), and PCM1 (PCM); NOAA GFDL2.0 (GFDL); and NASA GISS: C4x3 (GISS), E-H (GISS-EH), and E-R (GISS-ER). The first ensemble member of each model is analyzed in the present study for the 1951-1998 period and compared against the North American Regional Reanalysis (NARR), and the global NCEP and ECMWF (ERA-40) reanalyses; analysis of hydroclimate variability over North America in observations, reanalyses and AMIP simulations is done in papers by Ruiz-Barradas and Nigam (2005a, b) . Although the focus is on interannual variability, analysis of simulated summer and winter climatological precipitation shows important differences when compared with observations. Interannual variability of summer precipitation has a maximum over the US Great Plains region in NARR. While models do produce some precipitation variability over the region during summer, its spatial structure and linkages with other regions over the US and Mexico have large differences among the models and with respect to the reanalyses; the largest variability is in the GFDL model while it is the lowest in the GISS model. Reanalyses show the dominance of converging moisture fluxes over the local recycling of evaporation in generating precipitation anomalies over the region. However, in the model simulations the role of local recycling increases notably from being almost absent in the GISS-EH and GISS-ER models to be equally important in the CCSM3 and GFDL models. Interannual variability of winter precipitation on the other hand has two maxima in the US, one over the Northwest and another over the Southeast regions in NARR. Model simulations capture better the maximum over the US Northwest than the one over the US Southeast. Summer and Winter Climatology Summer (JJA) Standard Deviation of Precipitation Model Simulations Model Simulations Model Simulations Reanalyses Reanalyses Smoothed GPP Indices Figure1. Climatological Summer (June-August) and Winter (December-February) precipitation in regional and global reanalyses, and in model simulations. Contour interval is 1 mm/day, and values greater than 2 mm/day are shaded. Figure 2. Standard deviation of monthly precipitation during June-August in reanalyses and model simulations. Box in NARR marks the Great Plains region used in defining the Great Plains Precipitation (GPP) index whose smoothed version is displayed at the right. Contour interval is 0.3 mm/day, and values greater than 0.9 mm/day are shaded in the maps. Regressed JJA Precipitation Anomalies on GPP indices Regressed JJA Moisture Flux Anomalies on GPP indices Model Simulations Model Simulations Reanalyses Reanalyses Figure 4. JJA regressions of vertically integrated stationary moisture flux (vectors), and associated convergence (contours and shading), anomalies on GPP indices from reanalyses and model simulations. Contour interval and shading is as in figure 3; positive/negative anomalies denote moisture convergence/divergence. Moisture fluxes are scaled according to the insert of 50 kg/m/s at the bottom right. Notice the couplet of moisture flux divergence/convergence over central US/Gulf of Mexico, and associated fluxes from the Gulf of Mexico and Caribbean Sea, in NARR and the difficulties of the models to simulate it. Figure 3. JJA regressions of precipitation anomalies on GPP indices from reanalyses and model simulations. Contour interval is 0.3 mm/day, and values greater/smaller than 0.3/-0.3 mm/day are shaded. Because the GPP index is defined on the box, precipitation anomalies are centered over the region. Notice the localized anomalies in NARR, and the large structure in global reanalyses as well as in CCSM3, and GFDL simulations. Regressed JJA Evaporation Anomalies on GPP indices Winter (DJF) Standard Deviation of Precipitation Model Simulations Model Simulations Reanalyses Reanalyses Figure 5. JJA regressions of evaporation anomalies on GPP indices from reanalyses and model simulations. Contour interval is 0.1 mm/day, and values greater/smaller than 0.1/-0.1 mm/day are shaded. Notice that evaporation anomalies in reanalyses are much smaller than those in CCSM3 and GFDL simulations. Figure 6. Standard deviation of monthly precipitation during December-February in reanalyses and model simulations. Boxes in NARR mark two regions of large interannual variability that will be used in defining the Northwest and Southeast precipitation indices to analyze winter hydroclimate variability. Contour interval is 0.3 mm/day, and values greater than 0.9 mm/day are shaded. • Summary. • Climatological precipitation and its interannual variability in NARR, the gold target in the present analysis, agree well with observations • NCEP and ERA-40 reanalyses exhibit lesser accord with NARR. • Simulations of the 20th century hydroclimate variability have large differences among themselves and with reanalyses. • Great Plains precipitation variability is linked with rather different distributions of large-scale moisture fluxes in models and reanalyses. • Evaporation anomalies, via surface-atmosphere interactions in the models, produce precipitation anomalies in simulations in different degree, some of them in a stronger role than observations indicate. References Ruiz-Barradas, A., and S. Nigam, 2005a: Warm season rainfall over the U.S. Great Plains in observations, NCEP and ERA-40 reanalyses, and NCAR and NASA atmospheric model simulations. J Climate (in press). ———, and ———, 2005b: Warm season rainfall variability over the US Great Plains in the North American Regional Reanalysis and NCAR CAM3.0. To be submitted to J Climate.