Download
1 / 41
410 likes | 619 Vues
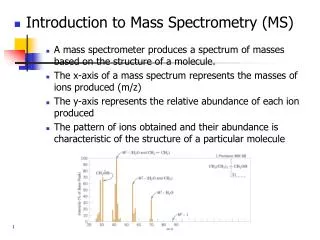
Introduction to Mass Spectrometry (MS) A mass spectrometer produces a spectrum of masses based on the structure of a molecule. The x-axis of a mass spectrum represents the masses of ions produced (m/z) The y-axis represents the relative abundance of each ion produced

E N D
Introduction to Mass Spectrometry (MS) • A mass spectrometer produces a spectrum of masses based on the structure of a molecule. • The x-axis of a mass spectrum represents the masses of ions produced (m/z) • The y-axis represents the relative abundance of each ion produced • The pattern of ions obtained and their abundance is characteristic of the structure of a particular molecule 1
Ionization (the formation of ions) • A molecule is bombarded with a beam of high energy electrons • An electron is dislodged from the molecule by the impact, leaving a positively charged ion with an unpaired electron (a radical cation) • This initial ion is called the molecular ion (M+.) because it has the same molecular weight as the analyte 2
Fragmentation • Excess vibrational energy is imparted to the molecular ion by collision with the electron beam - this causes fragmentation • The fragmentation pattern is highly characteristic of the structure of the molecule 3
Fragmentation by Cleavage at a Single Bond • Cleavage of a radical cation gives a radical and a cation but only the cation is observable by MS • In general the fragmentation proceeds to give mainly the most stable carbocation • In the spectrum of propane the peak at 29 is the base peak (most abundant) 100% and the peak at 15 is 5.6% 11
Fragmentation Equations • The M+. Ion is formed by loss of one of its most loosely held electrons • If nonbonding electron pairs or pi electrons are present, an electron from one of these locations is usually lost by electron impact to form M+. • In molecules with only C-C and C-H bonds, the location of the lone electron cannot be predicted and the formula is written to reflect this using brackets 12
Example: spectrum of neopentane • Fragmentation of neopentane shows the propensity of cleavage to occur at a branch point leading to a relatively stable carbocation • The formation of the 3o carbocation is so favored that almost no molecular ion is detected 14
Carbocations stabilized by resonance are also formed preferentially • Alkenes fragment to give resonance-stabilized allylic carbocations 15
Carbocations stabilized by resonance are also formed preferentially • Alkenes fragment to give resonance-stabilized allylic carbocations • Carbon-carbon bonds next to an atom with an unshared electron pair break readily to yield a resonance stabilized carbocation • Z=N, O, or S R may be H 15
Carbocations stabilized by resonance are also formed preferentially • Alkenes fragment to give resonance-stabilized allylic carbocations • Carbon-carbon bonds next to an atom with an unshared electron pair break readily to yield a resonance stabilized carbocation • Z=N, O, or S R may be H 15
Carbon-carbon bonds next to carbonyl groups fragment readily to yield resonance stabilized acylium ions 16
Carbon-carbon bonds next to carbonyl groups fragment readily to yield resonance stabilized acylium ions 16
Alkyl substituted benzenes often lose a hydrogen or alkyl group to yield the relatively stable tropylium ion • Other substituted benzenes usually lose their substitutents to yield a phenyl cation 17
Fragmentation by Cleavage of 2 Bonds • The products are a new radical cation and a neutral molecule • Alcohols usually show an M+.-18 peak from loss of water 18
Cycloalkenes can undergo a retro-Diels Alder reaction (section 13.11) to yield an alkadienyl radical cation 19
http://www.cem.msu.edu/~reusch/VirtualText/Spectrpy/MassSpec/masspec1.htmhttp://www.cem.msu.edu/~reusch/VirtualText/Spectrpy/MassSpec/masspec1.htm
The masses of molecular and fragment ions also reflect the electron count, depending on the number of nitrogen atoms in the species. Ions with no nitrogen or an even # N atoms Molecular Ion Fragment Ions odd-electron ions even-electron ions even-number mass odd-number mass Ions having an odd # N atoms Molecular Ion Fragment Ions odd-electron ions even-electron ions odd-number mass even-number mass
The masses of molecular and fragment ions also reflect the electron count, depending on the number of nitrogen atoms in the species. Ions with no nitrogen or an even # N atoms Molecular Ion Fragment Ions odd-electron ions even-electron ions even-number mass odd-number mass Ions having an odd # N atoms Molecular Ion Fragment Ions odd-electron ions even-electron ions odd-number mass even-number mass
3 Classes of Isotopes • M - only a single isotope • EX: F, P, I • M+1 - two isotopes with significant relative abundance differing by 1 mass unit • EX: H, C, N • M+2 - two isotopes with significant relative abundance differing by 2 mass units • EX: O, S, Cl, Br
Determination of Molecular Formulas & Weights • The Molecular Ion and Isotopic Peaks • The presence of heavier isotopes one or two mass units above the common isotope yields small peaks at M+.+1 and M+.+2 • Example: In the spectrum of methane one expects an M+.+1 peak of 1.17% based on a 1.11% natural abundance of 13C and a 0.016% natural abundance of 2H 6
Four Basic Rules • If M+ is even, then the unknown contains an even number of Nitrogen atoms (zero is an even number) • The abundance of M++1 indicates the number of Carbon atoms: # of C = relative abundance/1.1 • The abundance of the M++2 peak indicates the presence of O (0.2%), S (4.4%), Cl (33%) or Br (98%) • The remaining unknown mass can be attributed to Hydrogen 7
C – C – C - Cl H H H H H H H C3H7Cl • Is the molecular ion even? • Yes, there must be either an even number of N, or no Nitrogen atoms. • How many Carbon atoms are there? • # Carbons = 3 / 1.1 ≈ 3 carbon atoms • Is a O, S, Cl or Br present? • A M++2 peak of 33% indicates the presence of chlorine • How many Hydrogen atoms are there? • 78 = (1 * 35) + (3 * 12) + (H * 1) • 78 = 71 + H • # of Hydrogen atoms = 7 8
(M-1) % Intensity 86 (M+) 87 (M+1) 88 (M+2) H H H H H H H H H H H C – C – C – C – C = O C5H10O • Is the molecular ion even? • Yes, there must be either 0, 2, 4 … Nitrogen atoms • How many Carbon atoms are there? • # Carbons = 5.6 / 1.1 ≈ 5 carbon atoms • if there are 2 N atoms then the FW would be (5*12) + (2*14) = 88 • Therefore, there are no nitrogen atoms • Is an O, S, Cl or Br present? • A M++2 peak of .2% indicates O • How many Hydrogen atoms are there? • 86 = (5 * 12) + (O*1)+ (H * 1) • 86 = 76 + H • # of Hydrogen atoms = 10 • # of Hydrogen atoms = 10 8
Determination ofMolecular Formula distinguish between compounds of same MW C5H10O4 or C10H14
Determination ofMolecular Formula distinguish between compounds of same MW C5H10O4 13C 5 * 1.11% = 5.55% 2H 10 * 0.016% = 0.16% 17O 4 * 0.02% = 0.08% ------- 135peak/134peak 5.79%
Determination ofMolecular Formula distinguish between compounds of same MW C10H14 13C 10 * 1.11% = 11.1% 2H 14 * 0.016% = 0.22% ------- 135peak/134peak 11.32%
The Numbers Approach • If compound with formula CwHxNyOz , relative intensities of M, M+1, and M+2 ions will be given by:
High-Resolution Mass Spectrometry • Low-resolution mass spectrometers measure m/z values to the nearest whole number • High-resolution mass spectrometers measure m/z values to three or four decimal places • The high accuracy of the molecular weight calculation allows accurate determination of the molecular formula of a fragment • Example • One can accurately pick the molecular formula of a fragment with a nominal molecular weight of 32 using high-resolution MS 9
Elemental Composition Search Report: Target Mass: Target m/z = 227.04987 ± .003 Charge = +2 Possible Elements: Element: Exact Mass: Min: Max: C 12.000000 0 100 H 1.007825 0 100 Cl 34.968853 2 2 N 14.003074 2 2 Additional Search Restrictions: None Search Results: Number of Hits = 1 m/z Delta m/z DBE Formula 227.04963 0.00024 19.0 C28H20Cl2N2+2