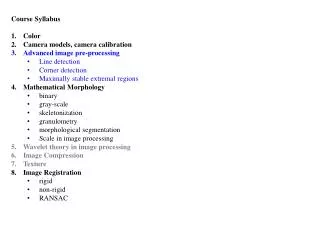
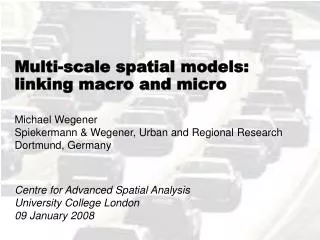
Multi-scale spatial models: linking macro and micro Michael Wegener
Multi-scale spatial models: linking macro and micro Michael Wegener Spiekermann & Wegener, Urban and Regional Research Dortmund, Germany Centre for Advanced Spatial Analysis University College London 09 January 2008. I ntegrated land-use transport models

Multi-scale spatial models: linking macro and micro Michael Wegener
E N D
Presentation Transcript
Multi-scale spatial models: linking macro and micro Michael Wegener Spiekermann & Wegener, Urban and Regional Research Dortmund, Germany Centre for Advanced Spatial Analysis University College London 09 January 2008
Integrated land-use transport models Today's integrated land-use transport models suffer from several weaknesses: - Their classification of households and individuals is too crude; individual lifestyles cannot be represented. - Their transport models are not activity-based and cannot address "soft" transport policies. - Their spatial resolution is too coarse to take account of small-scale local policies. - Forecasting environmental impacts such as air pollution, land take and traffic noise is difficult, modelling environ-mental feedback is impossible. - Issues of spatial equity cannot adequately be addressed.
Microsimulation New activity-based microsimulation models improve urban simulation models: -Individuallifestyles can be represented, households and individuals are disaggregated to the agent level. - Environmental impacts can be modelled with the required spatial resolution. -Environmental feedback between environment and land use and transport can be modelled. -Microlocations can be represented. Households affected by environmental impacts can be localised. PROPOLIS & ILUMASS
However ... To date, no full-scale microsimulation model of urban land use, transport and environment has become operational. There are still unresolved problems regarding the inter-faces between the submodels. The feedback between transport and location and environ-mental quality and location has not yet been implemented. Serious problems of calibration, stability and stochastic variation have not been solved. The computing time for existing models is calculated in terms of weeks or days, not hours. Conclusions
How much micro is enough? Despite these problems, microsimulation modellers engage in ever more ambitious plans to further raise the complexity and spatial resolution of their models. The common belief among most microsimulation modellers seems to be: the more micro the better. This is the dream of the one-to-one Spitfire. Conclusions
The one-to-one Spitfire "Simplifying assumptions are not an excrescence on model-building; they are its essence. Lewis Carroll once remarked that a map on the scale of one-to-one would serve no purpose. And the philosopher of science Russell Hanson noted that if you progressed from a five-inch balsa wood model of a Spitfire air plane to a 15-inch model without moving parts, to a half-scale model, to a full-size entirely accurate one, you would end up not with a model of a Spitfire but with a Spitfire". Robert M. Solow (1973)
How much micro is enough? There seems to be little consideration of the benefits and costs of microsimulation: - Where is microsimulation really needed? - What is the price for microsimulation? - Would a more aggregate model do? For spatial planning models, the answer to these questions depends on the planning task at hand. For instance, for modelling the impacts of transport on land use, much simpler travel models are sufficient. Conclusions
Macro or micro? These considerations lead to a reassessment of the hypothesis that eventually all spatial modelling will be microscopic and agent-based. Conclusions
?? Macro or micro? Adapted from Miller et al., 1998.
Conclusions (1) Only integrated microsimulationland-use transport models modelspermit the modelling of - "soft" and local planning policies - individual lifestyles - environmental impacts and feedback - microlocations and spatial equity. However, there is a price for the microscopic view in terms of data requirements and long computing times. There are privacy concerns and ethical issues involved. Conclusions
Conclusions (2) Under constraints of data collection and of computing time, there is for each planning problem an optimum level of conceptual, spatial and temporal resolution. This suggests to work towards a theory of balanced multi-scale models which are as complex as necessary for the planning task at hand and as simple as possible but no simpler. Future urban models will be modular and multi-scale in scope, space and time. Conclusions
Multi-Scale Modelling The Dortmund Example
Dortmund City Dortmund Dortmund Regions Zones Raster cells Model levels Multi-level Multi-scale
Dortmund City Dortmund Dortmund Regions Zones Raster cells Model levels
Production function Migration function Accessibility Income Transport policy GDP Population Labour force Unemploy- ment Employment SASI Model
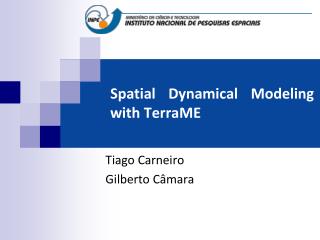
The STEPs Project (2004-2006) The EU 6th RTD Framework project STEPs (Scenarios for the Transport System and Energy Supply and their Potential Effects) developed and assessed possible scenarios for the transport system and energy supply of the future. In the project five urban/regional models were applied to forecast the long-term economic, social and environmental impacts of different scenarios of fuel price increases and different combinations of infrastructure, technology and demand regulation policies. Here the model results for the urban region of Dortmund, Germany, will be presented.
Fuel price increase +1% p.a. +4% p.a. +7% p.a. Do-nothing A-1 B-1 C-1 Business as usual A0 B0 C0 Infrastructure & technology A1 B1 C1 Demand regulation A2 B2 C2 All policies A3 B3 C3 The STEPs Project: Scenarios The project developed a set of scenarios assuming different rates of energy price increases with three sets of policies: A-1Reference Scenario
Münster Dortmund Dortmund Dortmund Duisburg Bochum Dortmund Essen Hagen Düsseldorf Cologne
Economic impacts for the Dortmund region According to the SASI model, the fuel price increases and related policies of the scenarios have significant negative impacts on the economy of the Dortmund urban region:
Dortmund City Dortmund Dortmund Regions Zones Raster cells Model levels
Internal zones External zones Study area Hamm Dortmund Bochum Hagen
b a r n U Very slow Very fast Fast Slow Very slow t E n n e v m i n r o Speed of change Urban systems Networks Goods transport Travel Employment Population Workplaces Housing Land use
Labour market Employment Workplaces Population households Market for nonresidential buildings Transport market Housing market Residential buildings Nonresidential buildings Land market from SASI model Microsimulation Dortmund model
Dortmund City Dortmund Dortmund Regions Zones Raster cells Model levels
The ILUMASS Project (2001-2006) The project ILUMASS (Integrated Land-Use Modelling and Transport Systems Simulation) embedded a microscopic dynamic simulation model of urban traffic flows into a comprehensive model system incorporating both changes of land use and the resulting changes in transport demand as well as their environmental impacts. For testing the land use submodels, the transport and environmental submodels were replaced by the aggregate transport model of the IRPUD model and simpler envir-onmental impact models (= reduced ILUMASS model).
from SASI model from SASI model Microsimulation Microsimulation Reduced ILUMASS model
0 < 20 < 40 < 60 < 80 < 100 < 120 < 140 < 160 < 180 < < 20 E/ha 40 E/ha 60 E/ha 80 E/ha 100 E/ha 120 E/ha 140 E/ha 160 E/ha 180 E/ha 200 E/ha 200 E/ha
Start Start Select a household Select a firm Demographic events - Ageing - Death - Birth - Marriage/cohabitation - Divorce/separation - Persons leave household - Persons move together Check satisfaction with present location Yes Satisfied? No Economic events - Education - Place of work - Employment status - Income - Mobility budget of household Select alternative location No No Accept? 1-10 11 Yes Update lists - Persons - Households - Dwellings - Firms Update lists - Firms - Nonresidential floorspace - Employed persons Yes Another firm? Another household? Yes No No End End Firms and households
Start Expected demand - Demolition - Upgrading - Construction Select project - Demolition - Upgrading - Construction Select type and num- ber of dwellings Select type and num- ber of dwellings Select type and num- ber of dwellings Select zone and microlocation Select zone and microlocation Select zone and microlocation Demolition and result-ing moves Construction Upgrading Update lists - Persons - Households - Dwellings - Construction Yes Another project? No End Dwellings
Housing demand Housing supply Start Start Select dwelling - Area - Type Select household - Outmigration - Immigration - New household - Move Select household - Immigration - New household - Forced move - Move Select dwelling - Area - Type No No No No Accept? Accept? 6 1-5 6 1-5 Yes Yes Update lists - Households: - with dwelling - without dwelling - Dwellings - occupied - vacant Update lists - Households: - with dwelling - without dwelling - Dwellings - occupied - vacant Yes Yes Another dwelling? Another household? No No End End Moves
Environmental Impacts and Feedback
Dortmund City Dortmund Dortmund Regions Zones Raster cells Model levels
PROPOLIS ILUMASS No spatial disaggregation Spatial disaggregation of output Spatial disaggregation of input Zonal data Zonal data Zonal data Spatial disaggregation Aggregate land-use transport model Aggregate land-use transport model Aggregate land-use transport model Aggregate land-use transport model Zonal environmental impact model Spatial disaggregation Microsimulation land-use transport model Disaggregate environmental impact model Disaggregate environmental impact model Few impacts Limited feedback All impacts Limited feedback All impacts All feedbacks Environmental feedback
Net residential density (Zone) Net residential density (Raster) Zone v. Raster Density
Percent open space (Zone) Percent open space (Raster) Zone v. Raster Open space
Mean No2 emission (Zone) Mean No2 exposure (Raster) Zone v. Raster Air pollution
Mean traffic noise (Zone) Mean traffic noise exposure (Raster) Zone v. Raster Traffic noise
from SASI model from SASI model Microsimulation Microsimulation Environmental impacts Reduced ILUMASS model