Spatial Data Mining
Spatial Data Mining. Outline. Motivation, Spatial Pattern Families Spatial data types and relationships Limitations of Traditional Statistics Location Prediction model Hotspots Spatial outliers Colocations and Co-occurrences Summary: What is special about mining spatial data ?.


Spatial Data Mining
E N D
Presentation Transcript
Outline • Motivation, Spatial Pattern Families • Spatial data types and relationships • Limitations of Traditional Statistics • Location Prediction model • Hotspots • Spatial outliers • Colocations and Co-occurrences • Summary: What is special about mining spatial data?
Learning Objectives • After this segment, students will be able to • Describe the motivation for spatial data mining • List common pattern families
Why Data Mining? • Holy Grail - Informed Decision Making • Sensors & Databases increased rate of Data Collection • Transactions, Web logs, GPS-track, Remote sensing, … • Challenges: • Volume (data) >> number of human analysts • Some automation needed • Approaches • Database Querying, e.g., SQL3/OGIS • Data Mining for Patterns • …
Data Mining vs. Database Querying • Recall Database Querying (e.g., SQL3/OGIS) • Can not answer questions about items not in the database! • Ex. Predict tomorrow’s weather or credit-worthiness of a new customer • Can not efficiently answer complex questions beyond joins • Ex. What are natural groups of customers? • Ex. Which subsets of items are bought together? • Data Mining may help with above questions! • Prediction Models • Clustering, Associations, …
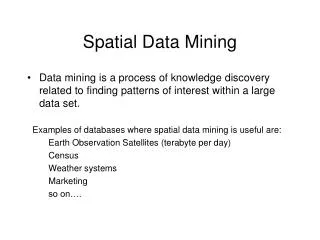
Spatial Data Mining (SDM) • The process of discovering • interesting, useful, non-trivial patterns • patterns: non-specialist • exception to patterns: specialist • from large spatialdatasets • Spatial pattern families • Hotspots, Spatial clusters • Spatial outlier, discontinuities • Co-locations, co-occurrences • Location prediction models • …
Pattern Family 1: Hotspots, Spatial Cluster • The 1854 Asiatic Cholera in London • Near Broad St. water pump except a brewery
Complicated Hotspots • Complication Dimensions • Time • Spatial Networks • Challenges: Trade-off b/w • Semantic richness and • Scalable algorithms
Pattern Family 2: Spatial Outliers • Spatial Outliers, Anomalies, Discontinuities • Traffic Data in Twin Cities • Abnormal Sensor Detections • Spatial and Temporal Outliers Source: A Unified Approach to Detecting Spatial Outliers, GeoInformatica, 7(2), Springer, June 2003. (A Summary in Proc. ACM SIGKDD 2001) with C.-T. Lu, P. Zhang.
Pattern Family 3: Predictive Models • Location Prediction: • Predict Bird Habitat Prediction • Using environmental variables
Family 4: Co-locations/Co-occurrence • Given: A collection of different types of spatial events • Find: Co-located subsets of event types Source: Discovering Spatial Co-location Patterns: A General Approach, IEEE Transactions on Knowledge and Data Eng., 16(12), December 2004 (w/ H.Yan, H.Xiong).
What’s NOT Spatial Data Mining (SDM) • Simple Querying of Spatial Data • Find neighbors of Canada, or shortest path from Boston to Houston • Testing a hypothesis via a primary data analysis • Ex. Is cancer rate inside Hinkley, CA higher than outside ? • SDM: Which places have significantly higher cancer rates? • Uninteresting, obvious or well-known patterns • Ex. (Warmer winter in St. Paul, MN) => (warmer winter in Minneapolis, MN) • SDM: (Pacific warming, e.g. El Nino) => (warmer winter in Minneapolis, MN) • Non-spatial data or pattern • Ex. Diaper and beer sales are correlated • SDM: Diaper and beer sales are correlated in blue-collar areas (weekday evening)
Quiz • Categorize following into queries, hotspots, spatial outlier, colocation, location prediction: (a) Which countries are very different from their neighbors? (b) Which highway-stretches have abnormally high accident rates ? (c) Forecast landfall location for a Hurricane brewing over an ocean? (d) Which retail-store-types often co-locate in shopping malls? (e) What is the distance between Beijing and Chicago?
Outline • Motivation, Spatial Pattern Families • Spatial data types and relationships • Limitations of Traditional Statistics • Location Prediction model • Hotspots • Spatial outliers • Colocations and Co-occurrences • Summary: What is special about mining spatial data?
Learning Objectives • After this segment, students will be able to • Describe the input of spatial data mining • List 3 common spatial data-types and operations • Use spatial operations for Feature Selection
Data-Types: Non-Spatial vs. Spatial • Non-spatial • Numbers, text-string, … • e.g., city name, population • Spatial (Geographically referenced) • Location, e.g., longitude, latitude, elevation • Neighborhood and extent • Spatial Data-types • Raster: gridded space • Vector: point, line, polygon, … • Graph: node, edge, path Raster (Courtesy: UMN) Vector (Courtesy: MapQuest)
Relationships: Non-spatial vs. Spatial • Non-spatial Relationships • Explicitly stored in a database • Ex. New Delhi is the capital of India • Spatial Relationships • Implicit, computed on demand • Topological: meet, within, overlap, … • Directional: North, NE, left, above, behind, … • Metric: distance, area, perimeter • Focal: slope • Zonal: highest point in a country • …
OGC Simple Features • Open GIS Consortium: Simple Feature Types • Vector data types: e.g. point, line, polygons • Spatial operations : Examples of Operations in OGC Model
OGIS – Topological Operations Interior(B) Exterior(B) Boundary(B) • Topology: 9-intersections • interior • boundary • exterior Interior(A) Boundary(A) Exterior(A)
Research Needs for Data • Limitations of OGC Model • Direction predicates - e.g. absolute, ego-centric • 3D and visibility, Network analysis, Raster operations • Spatio-temporal • Needs for New Standards & Research • Modeling richer spatial properties listed above • Spatio-temporal data, e.g., moving objects
Quiz Which of the following is not describing a spatial relationship? a) Seoul is the capital of South Korea b) Slovakia and Hungary are neighboring countries c) Nile river crosses Sudan d) Venezuela is north of Argentina
Outline • Motivation, Spatial Pattern Families • Spatial data types and relationships • Limitations of Traditional Statistics • Location Prediction model • Hotspots • Spatial outliers • Colocations and Co-occurrences • Summary: What is special about mining spatial data?
Learning Objectives • After this segment, students will be able to • List limitations of traditional statistics for spatial data • Describe simple concepts in spatial statistics • Spatial auto-correlation • Spatial heterogeneity • Describe first law of Geography
Limitations of Traditional Statistics • Classical Statistics • Data samples: independent and identically distributed (i.i.d) • Simplifies mathematics underlying statistical methods, e.g., Linear Regression • Spatial data samples are not independent • Spatial Autocorrelation metrics • distance-based (e.g., K-function), neighbor-based (e.g., Moran’s I) • Spatial Cross-Correlation metrics • Spatial Heterogeneity • Spatial data samples may not be identically distributed! • No two places on Earth are exactly alike! • …
Spatial Statistics: An Overview • Point process • Discrete points, e.g., locations of trees, accidents, crimes, … • Complete spatial randomness (CSR): Poisson process in space • K-function: test of CSR • Geostatistics • Continuous phenomena, e.g., rainfall, snow depth, … • Methods: Variogram measure how similarity decreases with distance • Spatial interpolation, e.g., Kriging • Lattice-based statistics • Polygonal aggregate data, e.g., census, disease rates, pixels in a raster • Spatial Gaussian models, Markov Random Fields, Spatial Autoregressive Model
Spatial Autocorrelation (SA) • First Law of Geography • All things are related, but nearby things are more related than distant things. [Tobler70] • Spatial autocorrelation • Traditional i.i.d. assumption is not valid • Measures: K-function, Moran’s I, Variogram, … Independent, Identically Distributed pixel property Vegetation Durability with SA
[number of events within distance hof an arbitrary event] Spatial Autocorrelation: K-Function • Purpose: Compare a point dataset with a complete spatial random (CSR) data • Input: A set of points • where λis intensity of event • Interpretation: Compare k(h, data) with K(h, CSR) • K(h, data) = k(h, CSR): Points are CSR > means Points are clustered < means Points are de-clustered CSR Clustered De-clustered
[number of typej event within distance h of a randomly chosen typeievent] Cross-Correlation • Cross K-Function Definition • Cross K-function of some pair of spatial feature types • Example • Which pairs are frequently co-located • Statistical significance
Recall Pattern Family 4: Co-locations • Given: A collection of different types of spatial events • Find: Co-located subsets of event types Source: Discovering Spatial Co-location Patterns: A General Approach, IEEE Transactions on Knowledge and Data Eng., 16(12), December 2004 (w/ H.Yan, H.Xiong).
Illustration of Cross-Correlation • Illustration of Cross K-function for Example Data Cross-K Function for Example Data
Spatial Heterogeneity • “Second law of geography” [M. Goodchild, UCGIS 2003] • Global model might be inconsistent with regional models • Spatial Simpson’s Paradox • May improve the effectiveness of SDM, show support regions of a pattern
Edge Effect • Cropland on edges may not be classified as outliers • No concept of spatial edges in classical data mining Korea Dataset, Courtesy: Architecture Technology Corporation
Research Challenges of Spatial Statistics • State-of-the-art of Spatial Statistics Data Types and Statistical Models • Research Needs • Correlating extended features, road, rivers, cropland • Spatio-temporal statistics • Spatial graphs, e.g., reports with street address
Quiz Which of the following is not attributed to spatial auto-correlation? a) Nearby cities have similar climate b) Neighboring areas tend to plant similar farm crops c) Near things are more related than distant things d) Spatial data mining results are less reliable near the edges of a study area
Outline • Motivation, Spatial Pattern Families • Spatial data types and relationships • Limitations of Traditional Statistics • Location Prediction model • Hotspots • Spatial outliers • Colocations and Co-occurrences • Summary: What is special about mining spatial data?
Learning Objectives • After this segment, students will be able to • Compare traditional & location prediction models • Contrast Linear Regression & Spatial Auto-Regression
Illustration of Location Prediction Problem Nest Locations Vegetation Index Water Depth Distance to Open Water
Location Prediction Models • Traditional Models, e.g., Regression (with Logit or Probit), • Bayes Classifier, … • Spatial Models • Spatial autoregressive model (SAR) • Markov random field (MRF) based Bayesian Classifier
Comparing Traditional and Spatial Models • Dataset: Bird Nest prediction • Linear Regression • Lower prediction accuracy, coefficient of determination, • Residual error with spatial auto-correlation • Spatial Auto-regression outperformed linear regression ROC Curve for learning ROC Curve for testing
Modeling Spatial Heterogeneity: GWR • Geographically Weighted Regression (GWR) • Goal: Model spatially varying relationships • Example: Where are location dependent Source: resources.arcgis.com
Research Needs for Location Prediction • Spatial Auto-Regression • Estimate W • Scaling issue • Spatial interest measure • e.g., distance(actual, predicted) Prediction 2. Spatially more interesting than Prediction 1 Actual Sites Pixels with actual sites Prediction 1
Quiz Which of the following is true about spatial autoregressive model (SAR)? a) It has lower computational cost than traditional regression model b) It takes neighborhood information into account c) It is less general than traditional regression model d) None of the above
Outline • Motivation, Spatial Pattern Families • Spatial data types and relationships • Limitations of Traditional Statistics • Location Prediction model • Hotspots • Spatial outliers • Colocations and Co-occurrences • Summary: What is special about mining spatial data?
Learning Objectives • After this segment, students will be able to • Compare traditional & spatial clustering methods • Contrast K-Means and SatScan
Clustering Question Question: What are natural groups of points?
Maps Reveal Spatial Groups B F 20 C y Map shows 2 spatial groups! E 10 D A 30 40 50 x
K-Means Algorithm B F 20 C y 1. Start with random seeds E 10 D A K = 2 30 40 50 Seed x Seed
K-Means Algorithm B F B F 20 20 C C y y 2. Assign points to closest seed E 10 E 10 D A K = 2 Seed D A Seed 30 40 50 30 40 50 x x
K-Means Algorithm B F 20 C y 3. Revise seeds to group centers E 10 K = 2 D A 30 40 50 x Revised seeds