Discovering Climate Indices Through Clustering Techniques in Environmental Research
This project presents the discovery of climate indices using advanced clustering methodologies, focusing on spatio-temporal patterns from Earth Science data. It aims to address climate change impacts such as drought, flooding, and agricultural challenges by employing innovative data mining techniques. The research, led by renowned experts from UMass Boston and collaborators from NASA and other institutions, outlines the background of climate science, existing methods' limitations, and the new clustering-based approach for efficient results in identifying significant climate phenomena.

Discovering Climate Indices Through Clustering Techniques in Environmental Research
E N D
Presentation Transcript
Spatial Data MiningCS 697 Assignment 1 February 16, 2010 Pradnya Khutafale, Peter Lucas, and Chris Maio Advisor: Dr. Wei Ding Computer Science Department UMass Boston 1
Discovery of Climate Indices using Clustering Principal Investigators Vipin Kumar (University of Minnesota) Michael Steinbach (University of Minnesota) Collaborators Steven Klooster (Cal. State Univ, Monterey Bay) Christopher Potter (NASA Ames Research Center) Pang-Ning Tan (Michigan State University) 2
Researchers Department of Computer Science and Engineering Michael Steinbach Pang-Ning Tan Vipin Kumar • Leading educators in the field of spatial data mining • Investigating the use of data mining techniques to find interesting spatio-temporal patterns from Earth Science • Regarded as leaders in the field of climate indices identification and data mining research Discovery of Climate Indices using Clustering
Researchers NASA & Ames Research Center team members: Chris Potter Steven Klooster Working on cutting edge computer science methods and technologies to be utilized for finding solutions to complex environmental problems. Discovery of Climate Indices using Clustering
Presentation Outline • Background: (Chris) • Climate Change • Earth System Linkages • Earth Science Data and Climate Indices (Chris) • Existing Eigenvalue Techniques and Limits (Pete) • New Clustering Based Methodology (Pete) • Results and Comparisons (Pradnya) • Conclusions and Future Research (Pradnya and Pete) Discovery of Climate Indices using Clustering 5
Presentation Outline Background: Climate Change Earth System Linkages Earth Science Data and Climate Indices Existing Eigenvalue Techniques and Limitations New Clustering Based Methodology Results and Comparisons Conclusions and Future Research 6 Discovery of Climate Indices using Clustering
Background Climate Change Extinctions of plants and animals Rise in global temperatures IPCC Predictions 7 Sea-level Rise Discovery of Climate Indices using Clustering
Background Climate Change Impacts • Climate Change leads to significant changes of rainfall and soil moisture (drought and flood) • Agricultural activities (crop growth cycle) and world food supplies are affected greatly by climatic factors (desertification) • Climate change increases the frequency, intensity, and distribution of natural hazards, such as hurricanes and other storms 8 Discovery of Climate Indices using Clustering
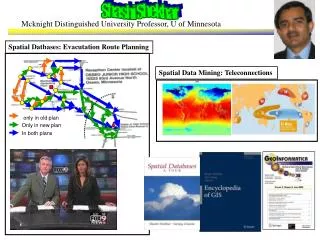
Background Earth System Linkages • Ocean, atmosphere, and land processes are highly coupled • Climate phenomena in one location can affect the climate at a far away location this is known as climate teleconnections • Understanding climate “teleconnections” key to knowing and predicting ecosystem response to climate change Discovery of Climate Indices using Clustering
Presentation Outline Background: Climate Change Earth System Linkages Earth Science Data and Climate Indices Existing Eigenvalue Techniques and Limitations New Clustering Based Methodology Results and Comparisons Conclusions and Future Research 10 Discovery of Climate Indices using Clustering
Earth Science Data Time Series Data • Sea Surface Temperature (SST) • Sea Level Pressure (SLP)
Earth Science Data Data Acquisition There are thousands of floats, buoys, and other remote sensing devises throughout the oceans collecting enormous amount of oceanographic data periodically transmitted to shore via satellite (Naval Research Laboratory). 12 Discovery of Climate Indices using Clustering
Preprocessing Required Earth Science Data Spatial and temporal nature of data poses a number of challenges Noisy Cycles of varying lengths and regularity Strong seasonal component Displays long term trends Displays temporal and spatial Autocorrelation 13 Discovery of Climate Indices using Clustering
Climate Indices Climate Indices = Data time series that summarize physical behavior of different regions of ocean and atmosphere Distill climate variability at regional or global scale into a single and manageable time series Usually based on sea level pressure and sea surface temperature Past methods of indication painstakingly slow and tedious 14 Discovery of Climate Indices using Clustering
Climate Indices Climate Index: Nino 1+2 15 Discovery of Climate Indices using Clustering
16 Discovery of Climate Indices using Clustering
Climate Indices El Nino Correlations SST of El Nino correlated indices
Climate Indices Detection of Climate Indices • Earth Scientists have devoted a significant amount of time discovering climate indices • Traditional approaches include direct observation of climate phenomena (El Nino) • Use of linear algebra techniques including eigenvalue analysis Discovery of Climate Indices using Clustering
Climate Indices Eigenvalue Analysis • Driven by massive amount of data obtained from satellites and remote sensing devises • Provides a way to quickly and automatically detect patterns in large amounts of data Jason-2 IR satellite image Discovery of Climate Indices using Clustering
Climate Indices Eigenvalue Analysis • Eigenvalue techniques include: • Principle Components Analysis (PCA) • Single Value Decomposition (SVD) • Limitations of Eigenvalue Analysis • Weaker signals may be masked by stronger signals • All Discovered signals must be orthogonal to each other making it difficult to attach a physical interpretation to them Discovery of Climate Indices using Clustering
Climate Indices Alternative Clustering Methodology • Utilization of data mining techniques and enormous amount of remote sensing data to find climate indices • Analysis yields clusters that represent ocean regions with relatively homogeneous behavior • Centroids of these areas summarize behavior particular region • Finding “meaningful” clusters will enable Earth Scientists to better predict changes in climate system Discovery of Climate Indices using Clustering
Climate Indices Benefits of Clustering • Discovered signals do not need to be orthogonal or statistically independent of one another • Signals are more easily interpreted • Weaker signals are more readily detected • It provides an efficient way to determine the influence of large set of points (all ocean point) on another large set of points (all land points) Discovery of Climate Indices using Clustering
Climate Indices Results of Clustering Methodology • Candidate Indices highly correlated to known indices representing rediscovery of well known indices and validation of methods • Variants to well-known indices which may be better predictors of land behavior for some regions of land • Cluster centroids that have medium or low correlation with known indices may represent new Earth science phenomena Discovery of Climate Indices using Clustering
Presentation Outline Background: Climate Change Earth System Linkages Earth Science Data and Climate Indices Existing Eigenvalue Techniques and Limitations New Clustering Based Methodology Results and Comparisons Conclusions and Future Research 24 Discovery of Climate Indices using Clustering
Eigenvalue Techniques Finding Spatial or Temporal Patterns using SVD Analysis SVD: Singular Value Decomposition • Earth Scientists typically used SVD analysis to identify climate indices • Goal : To find a new set of attributes that better describe variability in the data, through dimensionality reduction • Its operation can be thought of as revealing the internal structure of the data in a way which best explains the variance in the data Karl Pearson, Statistician 1857 – 1936 Discovery of Climate Indices using Clustering
Eigenvalue Techniques Overview of SVD Analysis • These techniques applied to a data set in the form of a data matrix (m by n) • m rows (objects) • n columns (attributes) • Data Matrix: a variation of record data in that it consists of all numeric attributes Example of a data matrix Discovery of Climate Indices using Clustering
Eigenvalue Techniques Overview of SVD Analysis • Assume the data objects in a matrix all have the same fixed set of attributes • Each data object can be thought of as a point, or Vector in multidimensional space • Each spatial dimension represents a distinct attribute describing the object Discovery of Climate Indices using Clustering
Simple Example of SVD Analysis • Just using web, it’s hard to find intuitive explanation of SVD • Again, SVD is a way to expose underlying details of matrix Simple Example using Golf : 3 golfers play 9 holes, par every hole • How to predict score for a player on a given hole? • Assume two vectors, Player Ability and Hole Difficulty • Predicted score = Player Ability * Hole Difficulty • Hole difficulty is Left Singular Vector • Player Ability is Right Singular Vector Discovery of Climate Indices using Clustering
Eigenvalue Techniques Finding Spatial or Temporal Patterns using SVD Analysis • Given a data matrix, whose rows consist of time series from various points on the globe, the objective is to discover the strong temporal or spatial patterns in the data • SVD decomposes a matrix into two sets of patterns, which, that correspond to a set of spatial patterns (left singular vectors) and a set of temporal patterns (right singular vectors). • We can plot the temporal patterns regular line plot and the spatial patterns on a spatial grid and visualize these patterns. Discovery of Climate Indices using Clustering
Eigenvalue Techniques Example : Plotting SST (Sea Surface Temp) Temporal pattern of SST (blue) plotted against the NINO4 index (green) Strongest spatial pattern of SST Discovery of Climate Indices using Clustering
Eigenvalue Techniques Only useful for finding a few of the strongest signals Smaller patterns in data may be obscured Signals must be orthogonal to each other (statistically independent) May not identify all patterns in data Efficiency can be a concern Limitations of SVD Analysis Discovery of Climate Indices using Clustering
Presentation Outline Background: Climate Change Earth System Linkages Earth Science Data and Climate Indices Existing Eigenvalue Techniques and Limitations New Clustering Based Methodology Results and Comparisons Conclusions and Future Research 32 Discovery of Climate Indices using Clustering
Clustering Methods Clustering Based Methodology for the Discovery of Climate Indices • Two key steps for finding climate indices • Find candidate indices using clustering • Evaluate these candidate indices for Earth Science significance Clustering Method used for this study: SNN Clustering Algorithm Method “Searching Nearest Neighbors” Discovery of Climate Indices using Clustering
Clustering Methods Finding Candidate Indices Using Clustering SNN Clustering Algorithm • First finds the nearest neighbors of each data point • Next, redefines the similarity between pairs in terms of how many nearest neighbors the two points share • Using this definition of similarity the algorithm identifies core points • These Core Points are used to build clusters • SNN algorithms have time complexity O(n*log(n)) Graph of functions n(log n) and n Discovery of Climate Indices using Clustering
Clustering Methods Evaluation of Candidate Indices • Indices must be evaluated in terms of Earth Science significance (meaning the strength of the association between the behavior of a candidate index and land climate) • Goal is to find a numerical measure of the strength and association between the behavior of an index and land climate • To evaluate influence of climate indices on land, the researchers use Area-Weighted Correlation • Definition : The weighted average of the correlation of the candidate index with all land points, where weight is based on the area of the land grid point Discovery of Climate Indices using Clustering
Clustering Methods Calculating Area-weighted Correlation • Step 1 : Compute the correlation of the time series of the candidate index with the same time series associated with each land point • Step 2 : Compute the weighted average of the correlations, where the weight associated with each land point is its area • The resulting area-weighted correlation can be at most 1, min is 0 General Formula for W.A. Wc = weight of each value M Mc = some value to average General Correlation Index. 1 being strongest Discovery of Climate Indices using Clustering
Clustering Methods Comparison of Area-Weighted Correlations • Development of Baseline to compare the values of area weighted correlations of candidate indices • Histogram of area weighted correlation of 1000 random time series • No time series has a WAC >.1 This will be the baseline, and indicates whether a good candidate index Discovery of Climate Indices using Clustering
Clustering Methods Validation of Comparison Baseline • Below shown are weighted area correlations of 11 known indices • Note that 10/11 indices have a weighted area correlation of >.1 • If candidate index shows weighted area correlation >.1, investigate Graph of Weighted Area Correlation of Well know Climate Indices Discovery of Climate Indices using Clustering
Presentation Outline Background: Climate Change Earth System Linkages Earth Science Data and Climate Indices Existing Eigenvalue Techniques and Limitations New Clustering Based Methodology Results and Comparisons Conclusions and Future Research 39 Discovery of Climate Indices using Clustering
Results SST Based Candidate Indices • Used SST data over time period from 1958 and 1998 and applied SNN clustering • Obtained 107 clusters • Cluster centroids were used to categorize clusters into G0,G1,G2 and G3 groups depending on their correlation to known indices Discovery of Climate Indices using Clustering
Results 107 Sea Surface Temperature (SST) Clusters • Find Correlation with known index like SOI, NINO1+2 etc • Find Area Weighted correlation with land Discovery of Climate Indices using Clustering
Results SST Cluster Correlation Correlation between known indices with SST cluster centroids and SVD Components Discovery of Climate Indices using Clustering
Results NINO 3.4 NINO 1+2 NINO 4 NINO 3 G0: Clusters with correlation to known indices >= 0.8 • Veryhighly correlated • Rediscovered well-known indices • Serve to validate the approach Discovery of Climate Indices using Clustering
Results G0: SST Cluster Correlation Correlation between known indices with SST cluster centroids and SVD Components Discovery of Climate Indices using Clustering
Results G1: Clusters with correlation to known indices from 0.4 to 0.8 Discovery of Climate Indices using Clustering
Results G1: Cluster 29 vs. El Nino Indices Cluster 29 Discovery of Climate Indices using Clustering
Results G2: Clusters with correlation to known indices from 0.25 to 0.4 • Less correlated • May represent new earth science • phenomena • May be new index Discovery of Climate Indices using Clustering
Results Cluster 62 vs. El Nino Indices Cluster 62 Discovery of Climate Indices using Clustering
Results G3: Clusters with correlation to known indices <= 0.25 • Less correlated • May represent new earth science • phenomena or weaker version of • known phenomena • New index Discovery of Climate Indices using Clustering
Results SLPbased Candidate Indices • SLP data over time period from • 1958 to 1998 • Correlation measured as difference • of all pairs of cluster centriods • Negative correlation are interesting • candidates • 25 Clusters found 25 Sea Level Pressure Based Clusters Discovery of Climate Indices using Clustering