Download
1 / 52
520 likes | 710 Vues
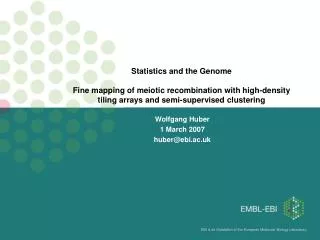
Statistics and the Genome Fine mapping of meiotic recombination with high-density tiling arrays and semi-supervised clustering. Wolfgang Huber 1 March 2007 huber@ebi.ac.uk. 15 Feb 2001: "The human genome is sequenced". But what does the sequence do?.

E N D
Statistics and the GenomeFine mapping of meiotic recombination with high-density tiling arrays and semi-supervised clustering Wolfgang Huber 1 March 2007 huber@ebi.ac.uk
But what does the sequence do? >gi|22046029|ref|NT_029998.5|Hs7_30253 Homo sapiens chromosome 7 reference genomic contig GATCTTATCTATCATGTTCACCTCCCAAGAGGTGAACATATCCCCCAAAGCCTGATAGAGAGAAGATGCTCATTAATATTTAATGCATGACCATGTGCAGACTTGGGAGGAAAAATATGCCTCAGCCTATCAATATTGGACCTTAATAAACAAGGATGTTTCTGCATCATTTCCCCACAACACCGAACAAGTGTGGCTCACTGTGGATGTTTAAGCAAATGCATTGTTTTTCCAGTTATATATCTGGTAGAGATGAGGCCATTGATAGGAATGGGAAGACGATCTCCTTTTATTTTGATGACCCAGCATGGCTGAACACTCAGTGACTACCACTGCACTTTGTTGTACTTTCAGCATTAGAGATGCCAGCCCTGTAGGATATAAAACAGGAACATCTAGTCCTCAATTATATTCAGAATTACTCAAGTCTTAGAAGCACCACTTGTCTTTTTTCAAGGGAGAGAAATGCTCAAGTGATGGGCTGAAGTGAAGGGAGGGAGTCACTCACTTGAACGGTTCCCTTAGGCTGTGTGGATGCAAACAGCATTAGACAATGACACTGACAGTGGGAAATGCACTGGAGACGATGACTGGCAAAGCCCTCCTTTTCTCCCCATCCACTATAGATACTGACAGCAAAGGGTTTGTCACAATGACAACTATACACTCCCAATATCACAGAAGAAGGAGGAATAAAAGGGTATATTATGAGTGACTGAAGTTTAGAATAAATTAATAAATATTATGTCCCTCATCCATAGAAACCACAAAGGTCTAGTAAGGCTAAGGATATAACAAGAAAATAATATGAATATTTGCTTCCCCTTCCTAGTGTAATAGAGTAAGTTACAAATGGCTTCAGGAAGGGGAGAGAGGAAGAAGAGTGGATGAGATACGTAAGAGTGCTTGAGGGCTAATTTTATGAAAGCTTTGGGAAGTTTTAAGAAAAAGAAAAGCTATTTTTCAAGGTACATGTGTGTATGCGTGTGTGTGTGTGTGTGTGTGTGTGTGTGTGTGTGTGTGTGTGAAAGACAGAAGAAAGAGGGAGACCTAAGAAGACTATGAGACACTAAGAGAAAAATTAAGGTAAAAAAGACACACACTTAGAAAAACACACATAGGGAGGAGGGAGGAGGTTAAGACATTTTACTATGTGCTGTGAATGGAAACTACAAACCATTTTTGATATATGCAATATATATACATATATACACACATATACATATGTATTTAAATATTTAAATTACATTTTCTCTTTTTTTAGAGATATGGTTTCACTATGTCACTCTGCCCAGGCTGCAGTACAGTGGTTGTTCACAGTCATGATCATAGCACATTATAGCCTTGAACTCCTGGGCTCAAGCAACCCTCCTGTATTAGTCTCCCCAGTAGTTGGGATTACTAGCATATGCCACCATGTCCACCTTTATGCTTTTTAAAGTGAAAAACCATACTAAGAATGAGGCAGCTCAACTTAATAATAAAAACATTTCAAATGTAAAGAAATTTACAAAAGAAAAACAATCAACCCCATTAAAATTGGGCAAAGGGAATGAACAGACACTTTTCAAAAGAATACATGCATGCAGCCAACAAACATACAAAAAAAAAGTTCAACATCACTGATCATTAGAGAAATGCAAATCAAAACCATAATGAGATACCATCTCACACCAGTCAGAATAGCTATCATTAAAAAGTCAAAAAATAACAGATGCTAGTGAGGCTATGGAGAAAAGGGAATGCTTATACACTGTTGTTGGGTGTGCAAATCAGTTCAATCATTGTGCAAGGAAAGTGATTCCTCAAAGAGCTAAAAGCAGAGCTACCATTCGACCCAGTAATCCCACTACTGGGTATATACCCAGATGAATATAAACCATTCTACCATAAAGACACATGCATACAAATGTTCATTGCAGCACTGTTCACAATAGCAAAAGTATGGGATCAACCTAATGCCCATCAATGACAGATTGGATAAAGAAAATGTGGTACATATACACCATGGAATACTATGCCGCCATTAAAAATGATATCATGTCTTTTGCTGGAATATGGATGGACCTTCTATTATCCTTAGCAAACTAATGCAGGAACAGAAAACCAAATATAGCATACTCTCAGTTATAAGTGGGAGCTAAA
This talk Background Genomics and "Systems biology" Computational statistics, Bioconductor Research Meiotic recombination fine mapping with tiling array
transcription translation DNA mRNA Protein Molecular network Organism The different levels of biological information processing
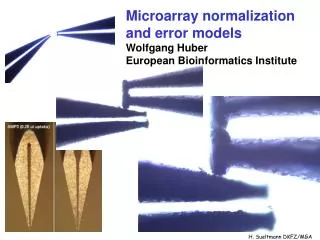
Measurements Like in any natural science, progress in biology is driven by what we can see / measure. Complexity of biologial systems (set of components and their interactions) requires miniaturized, highly parallel, automated measurement apparatus o microarrays o cell-based assays o microscopy o DNA or cDNA sequencing
marrays Millions of probes A good match sticks, a bad one doesn't Images by Affymetrix
an open sourceand open development software project for the analysis of biomedical and genomic data. started in 2001 and includes core developers in the US, Europe, and Australia. the computer language R and its package system are used to design and distribute software. (Inclusion of C and Fortran code is simple, others possible) 6-monthly releases, >230 packages from >100 authors, thousands of users, active mailing list, workshops www.bioconductor.org
Goals of the Bioconductor project Provide access for all scientists to powerful statistical and graphical methods for the analysis of genomic data Facilitate the integration of biological metadata (e.g. Ensembl, GOA, NCBI) in the analysis of experimental data Allow rapid development of extensible and interoperable software Encourage the use of self-describing data objects Promote high-quality documentation and reproducible research. Provide training in computational and statistical methods
Why are we Open Source publish the algorithm rather than the paper article about the algorithm so that you can find out what algorithm is being used, and how it is being used so that you can modify the algorithms to try out new ideas or to accommodate local needs so that they can be used as components in further work analogy with scientific publication one economic model does not fit all (we do not provide nice GUIs, telephone hotlines, backward compatibility)
RNAi is a post-transcriptional gene-silencing process... ...that can be applied in a high-throughput fashion on the cell or organism scale.
RNAi experiments in different organisms C. elegans Drosophila Mammals E. coli dsRNA dsRNA siRNA T7 > 200bp > 200bp 21bp Injection and soaking Feeding bacteria Bathing Cell culture Worms Precursor dsRNA DICER siRNAs Degradation of target message
Signaling pathways Antibacterial signalling (drosophila) Toll/antifungal signaling
Automated high-throughput image analysis: feature extraction and cell phenotype classification Dapi Dapi Tubulin Tubulin Phalloidin Phalloidin Dapi Dapi Tubulin Tubulin Phalloidin Phalloidin Experimental data: automated fluorescent microscopy; 3 channels x 4 replicates x 20,000 genes Data by Florian Fuchs, Michael Boutros, DKFZ, Heidelberg, 2005-2007
EBImage package Image processing and analysis on large sets of images in a programmatic fashion Combines algorithms of ImageMagick and other image processing libraries with statistics and programming capabilities of R Mathematical morphology Segmentation Voronoi diagrams with Riemann metrics Feature extraction Machine Learning – clustering, classification and statistical testing on image descriptors Collaboration with Michael Boutros, Florian Fuchs (DKFZ) thresholding original image opening/closing distance map detected nuclei & cells cells detected
Yeast as a model organismcommon descent of all living organismsless complicated than humans (6,000 genes instead of 30,000, less duplication and redundancy, little splicing, uni-cellular)the most popular model for studying basic processes of cell cycle and transcription
An S. cerevisiae Tiling Array 4 bp tiling path over complete genome (12 M basepairs, 16 chromosomes) Sense and Antisense strands 6.5 M oligonucleotides 5 mm feature size manufactured by Affymetrix designed by Lars Steinmetz (Stanford/EMBL)
Use of the tiling array to detect transcription cf. Martens et al., Intergenic transcription is required to repress the Saccharomyces cerevisiae SER3 gene. Nature429, 571-574 (2004).
CBF1 CBF1: important for growth in rich media GO of genes with antisense transcripts: cell wall, transcriptional regulation, meiotic cell cycle… Finding and mapping new transcripts
Meiotic recombination Lars Steinmetz EMBL HD Richard Bourgon EBI Eugenio Mancera EMBL HD
Meiotic recombination • Meiosis • A diploid parent divides twice, yielding 4 haploid daughter cells. From Molecular Biology of the Cell, Fourth Edition.
Meiotic recombination • Meiosis • A diploid parent divides twice, yielding 4 haploid daughter cells. • Programmed double-stranded breaks • Only 2 double-strands and 1 DSB are shown. • Distribution of DSBs is not uniform!
Holliday Junctions Courtesy of B. Engels, Univ. Wisconsin
Meiotic recombination • Meiosis • A diploid parent divides twice, yielding 4 haploid daughter cells. • Programmed double-stranded breaks • Only 2 double-strands and 1 DSB are shown. • Distribution of DSBs is not uniform! • Crossover • Each Holliday junction may resolve in one of two ways. Some resolution patterns produce a crossover. • Regions of gene conversion may occur. Based on B de Massy, TRENDS in Genetics 19(9), 2003
Meiotic recombination • Meiosis • A diploid parent divides twice, yielding 4 haploid daughter cells. • Programmed double-stranded breaks • Only 2 double-strands and 1 DSB are shown. • Distribution of DSBs is not uniform! • Crossover • Each Holliday junction may resolve in one of two ways. Some resolution patterns do not produce a crossover. • Regions of gene conversion may occur. Based on B de Massy, TRENDS in Genetics 19(9), 2003
Meiotic recombination • Meiosis • A diploid parent divides twice, yielding 4 haploid daughter cells. • Programmed double-stranded breaks • Only 2 strands and 1 DSB are shown. • Distribution of DSBs is not uniform! • Crossover • Each Holliday junction may resolve in one of two ways. Some resolution patterns do not produce a crossover. • Regions of gene conversion may occur. • Pre-ligation unwinding • Gene conversion may still occur. Based on B de Massy, TRENDS in Genetics 19(9), 2003
Research questions • In S. cerevisiae, where do hotspots occur and what are the local recombination rates? • Does location of hotspots or the local recombination rate correlate with features of DNA sequence or chromatin structure? • How large are conversion regions? Can we identify the various resolution patterns? • What is the relative frequency of the various DSB-repair pathways? • Does the observed pattern among recombination events concur with current models for “interference”? Do mutations impact interference?
Saccharomyces cerevisiae microarray data • Two strains • S96, isogenic to the common laboratory strain S288c. Fully sequenced. • YJM789, isogenic to the clinical isolate YJM145. Almost fully sequenced. • In alignable regions… • ≈ 67,000 known interrogated SNPs • ≈ 6,000 known interrogated insertions and deletions • Tiling microarray • ≈ 6.5M 5µm features (perfect/mismatch pairs) • Non-repetitive S96 sequence interrogated every 8 bases, on both strands • ≈ 4% of probes are specific to YJM789 sequence, at known polymorphic positions • Data • 25 parental genomic DNA hybridizations (13 S96 and 12 YJM789) • 200 offspring genomic DNA hybridizations (50 tetrads × 4 spores/tetrad)
“Single feature polymorphisms” • Hybridization to a short oligonucleotide is quantitatively sensitive to the number and position of mismatches. • Differential hybridization provides a means of detecting polymorphisms, even when only the reference genome sequence is known: SFPs. • Winzeler et al., Science 281(5380), 1998. • Brem et al., Science 296(5568), 2002. • Steinmetz et al., Nature 416(6878), 2002. • Borevitz et al., Genome Research 13(3), 2003. • Given parental behavior, segregants may be genotyped via supervised classification.
Single-probe methods • Polymorphism detection • Winzeler et al. (and others): ANOVA testing 1 = 1. Equivalent to a two-sample t-test assuming common variance. • Borevitz et al.: a moderated t-test using the SAM adjustment. • Brem et al.: a moderated t-test. Then, cluster all data (parental and segregant) ignoring genotype labels for parents. Discard SFPs for which clusters don’t separate the parental data. • Segregant genotyping • ANOVA and t-test methods use the estimated posterior probability of class membership, with a uniform prior on the classes: • Brem et al. augment this: are estimated from clustered data.
S96: CCTCCTGACCGGGATTGAAGTGATAAACATGTCTAGCGTTA YJM789: CCTCCTGACCGGGATTGAACTGATAAACATGTCTAGCGTTA Probe sets: SNP interrogation 6: CTTCACTATTTGTACAGATCGCAAT Probe sets: groups of probes which each exactly map to a unique location, and which interrogate a common polymorphism. 5: CTAACTTCACTATTTGTACAGATCG 4: GGCCCTAACTTCACTATTTGTACAG 2: GACTGGCCCTAACTTCACTATTTGT 1: GGAGGACTGGCCCTAACTTCACTAT 3: GACTGGCCCTAACTTGACTATTTGT
A multi-probe method Gresham et al., Science 311(5769), 2006: • Model the decrease in a given probe’s intensity in the presence of a single SNP, as a function of • SNP position within the probe, • Probe response to reference sequence, • Probe GC content and • Nucleotides surrounding the SNP position. • Fit model parameters using two sequenced strains with known SNPs. • To genotype a segregant or new strain at a given base, assume probes in a probe set are independent and compute a posterior probabilty (what they call “likelihood ratio”).
A multivariate method • Residual correlation remains after centering log intensities for each probe within inferred genotype class: a multivariate approach is justified.
A multivariate method • Residual correlation remains after centering log intensities for each probe within inferred genotype class: a multivariate approach is justified. • Parental arrays are informative, but do not always provide an ideal model. Supervised classification of offspring (i) wastes information, and (ii) may be misleading.
A multivariate method • Residual correlation remains after centering log intensities for each probe within inferred genotype class: a multivariate approach is justified. • Parental arrays are informative, but do not always provide an ideal model. Supervised classification of offspring (i) wastes information, and (ii) may be misleading.
An alternative multi-probe method • Residual correlation remains after centering log intensities for each probe within inferred genotype class: a multivariate approach is justified. • Parental arrays are informative, but do not always provide an ideal model. Supervised classification of offspring (i) wastes information, and (ii) may be misleading. • Existence of two clusters is necessary but not sufficient. Quantitative aspects of their (non-)overlap are useful.
Semi-supervised, model-based clustering C Fraley and AE Raftery, JASA 97(458), 2002: mclust package in R: • (X,Y)i with latent class variable Y. • Assume X|Y multivariate normal. • Initialize the estimates of Y with model-based, hierarchical agglomeration. • Compute MLEs for Gaussian means and covariance matrices via EM algorithm. • Optionally, select cluster count and covariance structure via BIC. Proposed procedure: • Provisional fits • Fit multivariate Gaussians to parental data. (Dimension reduction may be required.) • Unsupervised clustering of offspring data, by EM algorithm. • Final fit • Semi-supervised clustering of all arrays, by EM algorithm, provided that the probe set is “well behaved.”
Maximum likelihood and mixture model Mixture model whose maximum cannot typically be expressed in closed form. A prototypical application for the Expectation Maximization (EM) algorithm.
But sometimes the data will not fit • Except for spontaneous mutation, offspring should possess one parent genotype or the other at each polymorphic locus. • But the microarray probe behavior is not always this simple. Naive clustering can go wrong.
Tetrad-level events • Most gene conversion and crossover events can be automatically inferred. • Gaps arise from (i) lack of polymorphism, or (ii) regions which feature repeats or which could not be aligned given current sequence data.
Tetrad-level events • At many inferred crossover locations, polymorphism resolution is high enough to detect associated gene conversion tracts. • Currently, ≈4,300 inferred crossovers, ≈4,600 high-confidence conversions.