Systematic Mapping of Tissue-Dependent Alternative Exon Usage via RNAi and High-Throughput Microscopy
540 likes | 682 Vues
This project explores the genetic interactions and tissue-dependent alternative exon usage using advanced statistical computing, integrative bioinformatics, and mathematical modeling. By employing techniques such as RNA-Seq, ChiP-Seq, and high-throughput automated microscopy, we aim to elucidate the complex regulation of gene expression across various tissues. Through collaborations and the use of large-scale data sets, we seek to understand the biological significance of exon usage and its implications for cancer genomics and precision oncology.

Systematic Mapping of Tissue-Dependent Alternative Exon Usage via RNAi and High-Throughput Microscopy
E N D
Presentation Transcript
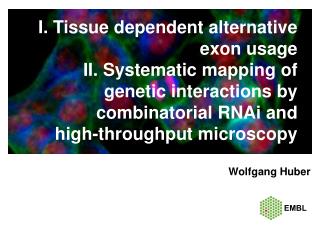
I. Tissue dependent alternative exon usageII. Systematic mapping of genetic interactions by combinatorial RNAi and high-throughput microscopy EMBL Wolfgang Huber
Progress in science is driven by technology We work on the methods in statistical computing, integrative bioinformatics and mathematical modelling to turn these data into biology. Sequencing - DNA-Seq, RNA-Seq, ChiP-Seq, HiCMicroscopy & remote sensing- molecular interactions and life-cycles in single, live cells Large scale perturbation libraries - RNAi, drugs
Research areas • Gene expression • Statistical method development: differential analysis • Alternative exon usage • 3D structure of DNA (HiC & Co.) • Single-cell transcriptomics and noise • collaborations with L. Steinmetz, P. Bertone, T. Hiiragi • Cancer Genomics & Precision Oncology • Somatic mutation detection (incl subclonal) • Phylogeny inference • collaborations with C.v.Kalle, H. Glimm, T. Zenz (NCT) • Genetic Interactions & phenotypes • Large-scale combinatorial RNAi & automated microscopy phenotyping • Cancer mutations & drugs • collaborations with M.Boutros (DKFZ) & T.Zenz and others • Basics of statistics • Tools & infrastructure for software ‘publication’ • Teaching • collaborations M.Morgan (FHCRC), R.Gentleman (Genentech)
Count data in HTS • Gene GliNS1 G144 G166 G179 CB541 CB660 • 13CDNA73 4 0 6 1 0 5 • A2BP1 19 18 20 7 1 8 • A2M 2724 2209 13 49 193 548 • A4GALT 0 0 48 0 0 0 • AAAS 57 29 224 49 202 92 • AACS 1904 1294 5073 5365 3737 3511 • AADACL1 3 13 239 683 158 40 • [...] • RNA-Seq • ChIP-Seq • HiC • Barcode-Seq • Peptides in mass spec • ... Simon Anders
two biologicalreplicates treatment vs control
Modelling Variance overcoming the small n, large p problem • To assess the variability in the data from one gene, we have • the observed standard deviation for that gene • that of all the other genes • ⇒Regularisation, Bayesian estimation
Alternative isoform regulation Alejandro Reyes Data: Brooks, ..., Graveley, Genome Res., 2010
Count table for a gene • number of reads mapped to each exon in a gene • treated_1 treated_2 control_1 control_2 • E01 398 556 561 456 • E02 112 180 153 137 • E03 238 306 298 226 • E04 162 171 183 146 • E05 192 272 234 199 • E06 314 464 419 331 • E07 373 525 481 404 • E08 323 427 475 373 • E09 194 213 273 176 • E10 90 90 530 398 <--- ! • E11 172 207 283 227 • E12 290 397 606 368 <--- ? • E13 33 48 33 33 • E14 0 33 2 37 • E15 248 314 468 287 • E16 554 841 1024 680 • [...]
GLM-approach to detect changes in relative exon usage: Bioconductor package DEXSeq • counts in gene i, sample j, exon l size factor dispersion expression strength in control change in expression due to treatment fraction of reads falling onto exon l in control change to fraction of reads for exon l due to treatment
PRKCZ PFC CB data: D Brawand et al. Nature 2011
Regulation of (alternative) exon usage • Data: multiple replicate samples each from: • 6 primate species (hsa, ppa, ptr, ggo, ppy, mml) X • 5 tissues (heart, kidney, liver, brain, cerebellum) • Brawand et al. Nature 2011 (Kaessmann Lab, Lausanne, CH)
Conservation: a core set of tissue-dependent exons across primates CTDR
Strong patterns of tissue-dependent exon usage are frequently conserved
Functional associations of conserved tissue-dependent exons CTDR CTDR
Tissue-dependent usage patterns are associated with splicing factor binding motifs and suggest a cis-regulatory code
Summary tissue-dependent exon usage • Detection of tissue-dependent regulation and its conservation across species at unprecedented scale and precision. • Most of tissue-dependent alternative exon usage in primates is • low amplitude • noise • little evidence for conservation • However, a significant fraction is • high amplitude • conserved • associated with function in mRNA life-cycle & localisation, translation regulation, protein interaction & function
Good scientific software is like a scientific publication • Reproducible • Peer-reviewed • Easy to access by other researchers & society • Builds on the work of others • Others will build their work on top of it • In bioinformatics, the software is the ‘real thing’, the paper is the advertisement
An international open sourceand open development software project • Statisticalmethods for the analysis of genomic data • Publication-quality graphics • Integration of biological metadata in the analysis of experimental data • Software: accessible, extensible, interoperable, transparent, well-documented • Approach: rapid development, code re-use, self-documenting datasets • Reproducible research • Training • Six-monthly release cycle; release 1.0 in March 2003 (15 packages), …, release 2.12 in April 2013 (>600 packages) • The world’s largest bioinformatics project.
Bioconductor Short Course: Brixen, South Tyrol, 23-28 June 2013 Bioinformatics of HT Sequencing Data RNA-Seq, ChIP-Seq Statistical testing, regression Machine Learning, Gene Set enrichment analysis Bioconductor Conference: Seattle, WA, 17-19 July 2013 Developer MeetingCambridge Dec 2013 Many further short courses & developer meetings: see www.bioconductor.org
How do we know which genes do what? • Forward genetics • from phenotypes to genes • → genome-wide association studies • → cancer genome sequencing Reverse genetics from genes to phenotypes → deletion libraries → high-throughput RNAi
Genetic interactions RNAi x RNAi DNA-mutation x RNAi DNA-mutation x drug
ICGC: 47 committed projects on ~18 entities to study >21000 tumour genomes Many chromatin modifiers Clonal heterogeneity Many recurrent mutations with low frequency Questions: How to assign function to the rare somatic mutations (“de-stratification”)? Need systems overview over genetic interactions Understand tumor phylogenies and mutual exclusivity
High-throughput RNAi and automated cellular phenotyping RNAi or drug library Feature extraction Segmentation g.x g.y g.s g.p g.pdm [1,] 123.1391 3.288660 194 67 9.241719 [2,] 206.7460 9.442248 961 153 20.513190 [3,] 502.9589 7.616438 219 60 8.286918 [4,] 20.1919 22.358418 1568 157 22.219461 [5,] 344.7959 45.501992 2259 233 35.158966 [6,] 188.2611 50.451863 2711 249 28.732680 [7,] 269.7996 46.404036 2131 180 26.419631 [8,] 106.6127 58.364243 1348 143 21.662879 [9,] 218.5582 77.299007 1913 215 25.724580 [10,] 19.1766 81.840147 1908 209 26.303760 [11,] 6.3558 62.017647 340 68 10.314127 [12,] 58.9873 86.034128 2139 214 27.463158 [13,] 245.1087 94.387405 1048 123 18.280901 [14,] 411.2741 109.198678 2572 225 28.660816 [15,] 167.8151 107.966014 1942 160 24.671533 [16,] 281.7084 121.609892 2871 209 31.577270 Quantitative cell and organelle features multivariate phenotypic landscape Michael Boutros Boutros, Bras, Huber, Genome Biol. 2006 Fuchs, Pau et al. Mol. Sys. Biol. 2010 Pau, Fuchs et al. Bioinf. 2010 Neumann et al. Nature 2010 Kuttenkeuler et al. J. Innate Imm. 2010 Axelsson et al. BMC Bioinf. 2011 Horn et al. Nature Methods 2011 Gregoire Pau
Genetic interactions for multiple phenotypes 384-well plates, microscopy readout with 3 channels (DAPI, phospho-His3, aTubulin) Fly: 1367 x 72 genes (Nat. Methods 2011 & unpublished) Human: 323 x 20 (Nat. Methods 2013) neg. ctrl Rho1 dsRNA Dynein light chain dsRNA number of cells area mitotic index shape variances 01/23/11 Bernd Fischer Horn*, Sandmann*, Fischer*, ..., Huber, Boutros. Nature Methods 2011 16
Multiple phenotypes are observed z-score z-score z-score z-score
3D data cube 1293 target genes x 2 dsRNA x 72 query genes x 2 dsRNA x 21 features Thomas Horn Thomas Sandmann
Genetic interaction map clustering of genetic interaction profilesred: ribosome biogenesisgreen: kinetochoreblue: centrosome
Co-complex score members of same protein complexes are enriched for high correlation of interaction profiles
Co-complexity score matrix Chaperonin-containing T-complex anaphase-promoting complex γ-tubulin ring complex DNA−directed RNA polymerase II core complex 26S proteasome
Evolutionary conservation and innovation in the mediator complex
Cancer mutations GI-map Glio- blastoma Medullo- blastoma Breast cancer Prostate carcinoma Colon carcinoma
Genetic interactions in human cells ~300 genes >200 features colon cancer cells
Genotype-dependence of drug sensitivity (CLL et al.) etc. Small molecule library Automated seeding of cells Measurement of ATP-levels Thorsten Zenz, Leo Sellner, NCT
drugs primary tumour samples with Thorsten Zenz, Leo Sellner, NCT L. Sellner
Quality control of dsRNA designs possible off-target effects 2 independent dsRNA designs per genequality criterion:cor. of multi-phenotype interaction profile between designs1293 genes passed QC
The transient and quantitative nature of RNAi induced phenotypes log2(rel. cell number) Ras85D (ng) drk (ng) • reagent concentration • (relative) timing of reagent applications and readout Interaction score positive (alleviating) none negative (aggravating) 7/11 01/23/11 Thomas Sandmann Horn*, Sandmann*, Fischer*, ..., Huber, Boutros. Nature Methods 2011 16
Interaction map cell number phenotype 1 AKT1-/-&AKT2-/- 2 MEK2-/- 3 AKT1-/- 4 CTNNB1 mt-/wt+ 5 PARENTAL007 6 P53 -/+ 7 P53-/- 8 PTEN-/- 9 PI3KCA mt-/wt+ 10 KRAS mt-/wt+ 11 BAX-/- 12 MEK1-/- 13 PARENTAL001 drugs cell lines
Interaction map cell number phenotype FDR=0.2 1 AKT1-/-&AKT2-/- 2 MEK2-/- 3 AKT1-/- 4 CTNNB1 mt-/wt+ 5 PARENTAL007 6 P53 -/+ 7 P53-/- 8 PTEN-/- 9 PI3KCA mt-/wt+ 10 KRAS mt-/wt+ 11 BAX-/- 12 MEK1-/- 13 PARENTAL001 drugs cell lines
Interaction map cell eccentricity phenotype FDR=0.1 1 AKT1-/-&AKT2-/- 2 MEK2-/- 3 AKT1-/- 4 CTNNB1 mt-/wt+ 5 PARENTAL007 6 P53 -/+ 7 P53-/- 8 PTEN-/- 9 PI3KCA mt-/wt+ 10 KRAS mt-/wt+ 11 BAX-/- 12 MEK1-/- 13 PARENTAL001 drugs cell lines