Download
1 / 19
190 likes | 302 Vues
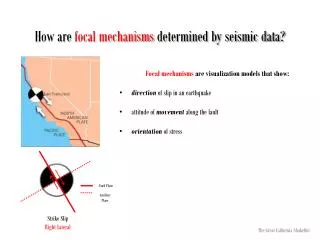
STRUCTURE OF THE MOON BY SEISMIC DATA. V.Yu. Burmin Schmidt Institute of Physics of the Earth, Russian Academy of Sciences, Moscow, Russia. Introduction

E N D
STRUCTURE OF THE MOON BY SEISMIC DATA V.Yu. Burmin Schmidt Institute of Physics of the Earth, Russian Academy of Sciences, Moscow, Russia
Introduction Between 1969 and 1972 by the American lunar program "Apollo" was deployed a network of high-sensitivity seismometers in the central part of the visible side of the Moon. Seismometers, "Apollo" continued to work for eight years, during which they passed on information about the natural seismic activity of the Moon, and the structure of the lunar crust and upper mantle. However, the deep portion of the Moon has remained inaccessible to the Apollo seismic network. As a result of observing not only the physical state and composition, but even the very existence of the lunar core remains in question. Since the seismic data, "Apollo" was impossible to determine the size and physical condition of the lunar core, this information was obtained from the study of the moment of inertia of the Moon, physical libration, and measu-rement of electromagnetic induction. As a result, it is assumed that the Moon has a small (R <400 kms), perhaps partially liquid core. Suggestive of its structure - it is solid solutions or melts of iron-nickel to Fe-FeS.
The first results of the velocity of seismic wave propagation in the interior of the Moon were published Nakamura et al. in 1973, 1974. On left fig. shows the travel-times of the first arrival of the P- and S-waves. In right fig. shows the distribution of P-and S-wave velocities for the crust, mantle and core of the Moon, obtained Nakamura et al. in 1974.
Hear in left fig. shows the velocity distribution of P- and S-waves in the crust and mantle of the Moon to a depth of 800 kms, obtained Nakamura et al. in 1976 for the same travel-time curves. In right fig. shows the velocity distribution of P- and S-waves in the crust and mantle of the Moon, obtained Goins et al. in 1981. A comparison of these velocity curves shows that the variation of velocities with depth in both figures differ slightly, but in right fig. values of P-wave velocity is slightly lower than in the left fig. but S-wave velocity at depths greater than 500 kms in right fig. conversely, higher than in left fig.
Here present the velocity curves for P-and S-waves, which are piece-wise constant function up to a depth of 1000 kms (Nakamura, 1983). From a physical point of view, the constant velocity in the range of depths from 500 to 1000 kms is not entirely justified, since the density and elastic modulid varies with depth. Besides these, there are a number of more recent work on the velocity structure of the moon. However, from my point of view, the subsequent results of the interpretation of seismic data did not improve the previous results. Due to the imperfections of the techniques, the results were internally inconsistent, and significantly different from previous results, especially in the middle and lower mantle of the Moon.
In recent years there appeared articles devoted to the refinement the radius of the Moon’s core by seismic data. In the article (Garcia et al., 2011) on reflected shear waves the estimations of a core of 38040 kms and average density 5.21.0 g/cm3 are given.
In (Weber et al., 2011) for the reflected and converted waves from the lunar core of the proposed three-layer model of the core. The internal core of radius 240 kms is supposed solid. A solid core surrounded by a liquid outer core, the thickness of which 90 kms. Further assumed a transitional layer of partially molten core-mantle boundary of 150 kms.
If the works to determine the velocity distribution in the interior of the Moon published a lot, then the density distribution is studied in a much lesser extent. The most fully investigated this question in the works of O. Kuskova and V. Kronrod. In left fig. presents the density distribution in the lunar mantle for the two composite models of the Moon obtained by the method Monte-Carlo and satisfying values of seismic velocities, and mass and moment of inertia of the Moon. In right fig. the acceptable variation of the density of the lunar mantle eutectic Fe-FeS core with a radius of 100-200 kms.
Input data The initial data for determining the velocity in the interior of the Moon were taken record-section seismograms shown in fig. Records of seismic events obtained from the radial long-period seismic stations of Apollo from falling meteorites and events as resulting of dumping space station modules.
The results of determining the velocity of seismic waves in the mantle The results of determining the velocities of P- and S-waves are shown in figure. Thickness of the crust according to various sources varies from 30-45 kms to 60 kms. We have taken the crust thickness 54 kms. The figure shows that in the mantle of the Moon in the depth range 120 - 480 kms there is a decrease in the velocity of both P- and S-waves. In the depth range 480 - 1100 kms of seismic wave velocities change little and remain almost constant. At a depth of 480 km there is a jump of velocities of P-and S-waves, which caused a sharp change in the apparent velocity of travel-time in the values of 7.2 km/s to 7.8 km/s for P- waves and from 4.2 km/s to 4.5 km/s for S-waves.
In this figure points are the experimental and lines are theoretical travel-time curves P-wave obtained for the velocity distributions. From this figure it can be clearly seen that the theoretical travel-time curves well fit the experimen-tal points.
In this figure points are the experimental and line is theoretical travel-time curves S-wave obtained for the velocity distributions. From this figure it can be clearly seen that the theoretical travel-time curves well fit the experimental points.
The density and elastic modules of the mantle of the Moon are determined from the equations Williamson - Adams for a given velocity distribution of P- and S-waves. To determine the distribution of velocities of seismic waves at depths greater than 1100 kms we have not observed data. Therefore, in contrast to the determination of the density in the core of the Earth, which is known the depth of the mantle-core boundary according to the reflected waves and the distribution of the velocity of P-waves in the core, the Moon does not know exactly of any position of the boundary mantle-core and the velocity distribution in the core. The initial data for determining the radius four models of the core of the Moon considered in accordance with results of Kuskov and Kronrod. For calculations were taken one of the last values of the dimensionless moment of inertia of the Moon – 0.3931 ± 0.02% (Konopliv et al., 1998). The mass of the Moon was taken to be 7.349 1022 kg ± 0,1%. The results of determinations are shown in next figures.
In figure shows the values of seismic velocities, density and elastic module correspond to the iron-nickel composition of the core and are VP = 6.15 km/s, VS = 3.20 km/s, = 8.10 g/cm3, r = 308.0 km.
Here shows the curves and the corresponding values of the elastic parameters of the iron with a 10% admixture of the sulfur core. For such core: VP = 5.81 km/s, VS = 2.96 km/s, = 5.66 g/sm3, r = 400.0 km.
This figure corresponds to the eutectic (Fe-FeS) composition of the core. For it the VP= 5.52 km/s, VS = 2.01 km/s, = 5.15 g/cm3, r = 438.5 km.
Finally, in figure shows the distribution of seismic velocities, density and elastic modules for troilit (FeS) core. In this case, VP = 5.22 km/s, VS = 1.31 km/s, = 4.70 g/cm3, r = 492.0 km.
Summary and Conclusions In this report, based on data obtained in the 70's Apollo program and a better method of interpreting seismic data held redefinition of the velocity distribution in the mantle of the Moon. Advantages of the method of inter-pretation is, first, to use the formulas for the invertion of discontinuous travel-time, and secondly, what could be more important in the approxi-mation of the observed travel-time convex cubic splines, which, unlike the others, previously used, methods of determining the apparent velocities are the best device for this purpose. As a result, velocity curves obtained by best satisfying the observed data, ie, the experimental travel-times.