Download

1 / 25
270 likes | 586 Vues
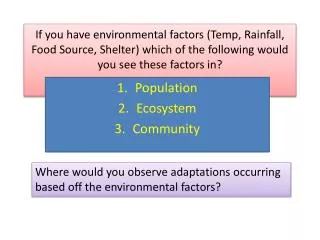
5.1.1 Define species , habitat , population , community , ecosystem and ecology . Species: a group of organisms that can interbreed and produce fertile offspring . Habitat: the environment in which a species normally lives or the location of a living organism .

E N D
5.1.1 Define species, habitat, population,community, ecosystem and ecology. • Species: a group of organisms that can interbreed and produce fertile offspring. • Habitat: the environment in which a species normally lives or the location of a living organism. • Population: a group of organisms of the same species who live in the same area at the same time. • Community: a group of populations living and interacting with each other in an area. • Ecosystem: a community and its abiotic environment. • Ecology: the study of relationships between living organisms and between organisms and their environment.
5.1.2 Distinguish between autotroph andheterotroph. • Autotroph: an organism that synthesizes its organic molecules from simple inorganic substances. • Heterotroph: an organism that obtains organic molecules from other organisms. • Hetero: means “other”
5.1.3 Distinguish between consumers,detritivoresand saprotrophs. • Consumer: an organism that ingests other organic matter that is living or recently killed. • Detritivore: an organism that ingests non-living organic matter. (ingest has a mouth) • Ex: shark eating dead material (detritus) that falls to ocean floor • Saprotroph: an organism that lives on or in nonliving organic matter, secreting digestive enzymes into it and absorbing the products of digestion. • Ex: mushroom
5.1.4 Describe what is meant by a food chain, giving three examples, each with at least three linkages (four organisms). WARNING: Only real examples should be used from natural ecosystems. A→ B indicates that A is being “eaten” by B (that is, the arrow indicates the direction of energy flow). Each food chain should include a producer and consumers, but not decomposers. Named organisms at either species or genus level should be used. Common species names can be used instead of binomial names. General names such as “tree” or “fish” should not be used.
Food Chain ex: phytoplankton zooplankton bay anchovy fish larvae juvenile striped bass Food Chain ex: phytoplankton krill baleen whales humans
5.1.5 Describe what is meant by a food web. • depicts feeding connections (what-eats-what) in an ecological community
5.1.6 Define trophic level. • Trophic Level: Position in the food chain, determined by the number of energy-transfer steps to that level; A functional classification of taxa within a community that is based on feeding relationships (eg, plants make up the first trophic level, herbivores make up the second).
5.1.7 Deduce the trophic level of organismsin a food chain and a food web. **Students should be able to place an organism at the level of producer, primary consumer, secondary consumer, and so on, as the terms herbivore and carnivore are not always applicable.
5.1.8 Construct a food web containing up to 10 organisms, using appropriate information.
5.1.9 State that light is the initial energysource for almost all communities.
5.1.10 Explain the energy flow in a food chain. Energy moves in one direction. It moves from the sun, through primary producers, then primary consumers, & so on. Energy losses between trophic levels include material not consumed or material not assimilated, and heat loss through cell respiration.
5.1.11 State that energy transformations arenever 100% efficient.
5.1.12 Explain reasons for the shape ofpyramids of energy. • A pyramid of energy shows the flow of energy from one trophic level to the next in a community. • Approximately 90% of the energy in a level is used by those organisms for cellular respiration. • Therefore, only about 10% of the energy is available to transfer to the next trophic level. • The units of pyramids of energy are: energy per unit area per unit time, for example, kJ m–2 yr–1.
From Click 4 biology: http://click4biology.info/c4b/5/eco5.1.htm#twelve • Explain means to give a detailed account of causes, reasons or mechanisms. • This model shows the typical loss of energy from solar radiation through the various trophic levels. • Note how this causes a tapering of the model • The volume of one layer is 10% of the layer below. • It is this loss of energy which in part makes food chains relatively short. • In extreme environments like the arctic the initial trapping of energy by producers is low. Thus the food chains are short. • In a tropic rainforest the trapping of energy is more efficient and therefore food chains are longer, webs are more complex. • This is a more typical pyramid of energy. Note that the initial solar energy is not shown. • The narrowing shape illustrates the gradual loss of energy progressing along the links of a food chain to higher tropic levels (see above for detail). • The base of this pyramid would have a scale = energy/ area/unit time e.g. kJ m-2 yr-1 • Unlike pyramids of number (of organisms) a pyramid of energy cannot invert due to the second law of thermodynamics,' energy cannot be created nor destroyed' .
5.1.13 Explain that energy enters and leavesecosystems, but nutrients must be recycled. • Energy flows: At each trophic level energy is lost as heat. At the top of the pyramid of energy it tapers to a point showing how all energy is ultimately radiated to space as heat. • Matter cycles: new matter is not created, no new carbon, hydrogen or oxygen. Producers (autotrophs) take inorganic molecules and convert them to organic compounds. Consumers feed at different trophic levels taking in organic matter and using it for their own growth. This cycling of matter is the subject of the carbon, nitrogen and water cycle.
5.1.14 State that saprotrophic bacteriaand fungi (decomposers) recycle nutrients.
5.2.1 Draw and label a diagram of thecarbon cycle to show the processes involved. The details of the carbon cycle should include the interaction of living organisms and the biosphere through the processes of photosynthesis, cell respiration, fossilization and combustion. Recall of specific quantitative data is not required.
5.2.2 Analyze the changes in concentrationof atmospheric carbon dioxide using historical records. • Analyze means to interpret data to reach conclusions. • The trends in atmospheric gases are studied as indicators of potential climate change. • Major gases studied include carbon dioxide, methane and oxides of nitrogen which are collectively called the greenhouse gases (5.2.3). • Atmospheric carbon dioxide has been monitored at Mauna Loa atmospheric laboratory on Hawaii since 1958. There are now other laboratories around the world which are adding to the database of carbon dioxide levels in the atmosphere. The graph below illustrates what is known as the Mauna Loa effect or the Keeling Curve. • Carbon dioxide is released unevenly around the world which in part is due to the distribution of vegetation. The collective data therefore allows us to see what happened after there is a mixing of the atmospheric carbon dioxide. • The analysis of carbon dioxide trends is complex and is affected by a number of factors and assumptions. • However the basic trend is an increase in atmospheric carbon dioxide levels.
5.2.3 Explain the relationship between rises in concentrations of atmospheric carbon dioxide, methane and oxides of nitrogen and the enhanced greenhouse effect. From IB: Students should be aware that the greenhouse effect is a natural phenomenon. Reference should be made to transmission of incoming shorter-wave radiation and re-radiated longer-wave radiation. Knowledge that other gases, including methane and oxides of nitrogen, are greenhouse gases is expected. Students should note: • Greenhouse effect is a natural process that creates moderate temperatures on earth to which life has adapted. The earth has relatively little carbon dioxide in its atmosphere compared to a planet like venus which has an atmosphere of CO2 x 200, 000 times greater and a surface temperature nearly twenty times higher than earth. • Enhanced greenhouse effect is the concern that the activities of human's may be increasing the levels of carbon dioxide and other 'greenhouse gases' such as methane and oxides of nitrogen in the atmosphere. That this may lead to increased global temperatures and climate change. Next slide for answer…
a) Short wave solar radiation (light) b) light penetrates the atmosphere and passes through the molecules of the atmosphere c) Absorption by the ground and conversion to long wave infrared radiation (heat) d)This warms the planet e) Some infrared is lost to space as heat f) Atmospheric gases particularly water vapour, carbon dioxide, methane and CFC's g) Greenhouse gases absorb infra-red radiation and scatter this rather than letting it escape to space. In effect this traps the heat energy. h) Some light reflects off the outer surface of the atmosphere and never enters **Note that if this 'greenhouse' effect did not exist the average global temperature would be -17 C. The enhanced greenhouse effect. • Increase in carbon dioxide and other greenhouse gases (methane, oxides of nitrogen) will increase the particles(f) in the above diagram. • Therefore more infra-red will be absorbed, scattered and retained as heat. • The average global temperatures will rise. Some models suggest as much as 40C in the next 50 years. • An enhanced greenhouse effect is predicted to cause global climate changes. This is often referred to as global warming but whilst the average global temperatures may rise the local effects may vary widely.
5.2.4 Outline the precautionary principle. The precautionary principle holds that, if the effects of a human-induced change would be very large, perhaps catastrophic, those responsible for the change must prove that it will not do harm before proceeding. This is the reverse of the normal situation, where those who are concerned about the change would have to prove that it will do harm in order to prevent such changes going ahead.
5.2.5 Evaluate the precautionary principle as a justification for strong action in response to the threats posed by the enhanced greenhouse effect. Consider whether the economic harm of measures taken now to limit global warming could be balanced against the potentially much greater harm for future generations of taking no action now. There are also ethical questions about whether the health and wealth of future human generations should be jeopardized, and whether it is right to knowingly damage the habitat of, and possibly drive to extinction, species other than humans. The environmental angle here is that the issue of global warming is, by definition, a genuinely global one in terms of causes, consequences and remedies. Only through international cooperation will a solution be found. There is an inequality between those in the world who are contributing most to the problem and those who will be most harmed.
5.2.6 Outline the consequences of a global temperature rise on arctic ecosystems. Effects include: • increased rates of decomposition of detritus previously trapped in permafrost, • expansion of the range of habitats available to temperate species, • loss of ice habitat, • changes in distribution of prey species affecting higher trophic levels, and • increased success of pest species, including pathogens.