Download
1 / 37
390 likes | 541 Vues
Lecture 04 Population regulation Spring 2013 Dr Ed Harris. 61BL3313 Population and Community Ecology. Announcements -lecture + tutorial today announcements: -R break for this week (use to catch up) -Moodle problem over the weekend -quiz marks this week, answers are up on *Moodle

E N D
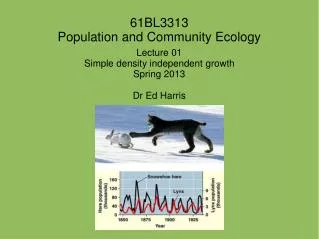
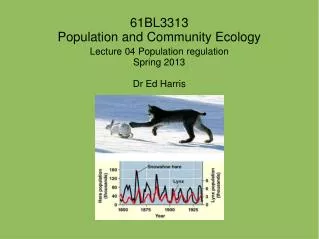
Lecture 04 Population regulation Spring 2013 Dr Ed Harris 61BL3313Population and Community Ecology
Announcements -lecture + tutorial today announcements: -R break for this week (use to catch up) -Moodle problem over the weekend -quiz marks this week, answers are up on *Moodle -issues, comments?
Today -population regulation -combining DD and DI -tests of density dependence -intro to population age structure
population regulation -What does this really mean? -Source of argument amongst ecologists for many years -historical argument mainly revolves around whether population size is regulated by DI factors, versus DD factors
population regulation The DI argument -many ecologists taking this view used small organisms as models of study, usually in areas with short growing seasons and/or characterized by drought
population regulation The DI argument
population regulation The DI argument -limited by availability of water -same as what limits range -DI -limited by availability of pollen -K -DD Thysanoptera thrip population growth eat pollen
population regulation The DI argument -Today, most ecologists consider this argument artificial and consider both DI and DD factors into population growth models -instead focus on what population regulation is... -keeping in mind what we discussed last time (time lags, reproductive potential, stochasticity), we might not expects stability at a specific K
population regulation -we discussed: stable point versus stable cycle -here, we can define population regulation as
population regulation -The point here is to EXPECT variation over time, around K, which can itself vary through time -Now THAT's variable
population regulation -we think of population regulation relying on DD, but DD alone is not a complete definition -for true population regulation, we need: i. tendency to return to K ii. this tendency must be strong enough to overcome DI and stochastic factors iii. time lag of return must not be "too long"
population regulation -to demonstrate population regulation, we need: i. an acceptable statistical test of DD ii. time series data of sufficient length to detect DD
Combining DD and DI to make predictions -this is the same equation as we used before for DD growth, except for the constant "D" -here D is the number of deaths caused by DI factors
Combining DD and DI to make predictions -D can be affected by stochastic factors -here the different lines are different levels of DI mortality -note D can also be positive (e.g., bonanza years) -average of zero
tests of DD -needed for field or lab data analysis -a starting place -discrete growth model – lambda is population growth rate for a generation -take natural log (ln) of both sides
tests of DD -here, if we plot ln Nt+1 versus ln Nt we should have a straight line with a slope of 1.0 -remember this is for DI growth -therefore, a test for DD is to plot data in this way to see if slope is < 1.0 -NOTE here ln(lambda) = r!!
tests of DD -look exponential?
tests of DD -is there DD?
tests of DD -let's look at some real data on yeast population growth
tests of DD -is there DD?
tests of DD -in a review of 70 data sets for animal populations, slopes of growth were significantly < 1.0 in 63 of them -seems to be a lot of evidence for DD -however, this is a weak test for 2 reasons i. first, linear regression assumes data points are independent, here they aren't ii. measurement error leads to slopes < 1.0
tests of DD -a second approach to test DD is to look at per capita growth rate versus population size -if DD, per capita growth should decrease! -we looked at this already in the lab, with our water lily population
tests of DD -evidence of DD?
tests of DD -evidence of DD?
tests of DD -let's look at some field data -Christmas Bird Count (CBC) project, Chesapeake Bay coastal plain waterfowl, Maryland. Another in Piedmont , PA -CBC began in late 1880s (replaced traditional bird hunt!)
tests of DD -Piedmont pop increasing (r = ~0.17) -CP increasing variation...
tests of DD -now let's go through our DD tests (remember we have 2), for each of the populations -First the ln N slope == 1.0 method
tests of DD -Piedmont Canada geese - DD?
tests of DD -coastal plain Canada geese - DD?
tests of DD -now we'll use the per capita growth negative slope method
tests of DD -Piedmont Canada geese - DD?
tests of DD -coastal plain Canada geese - DD?
summary 1 The per capita rate of change, r, is affected by both endogenous and exogenous factors, and both should be examined when attempting to understand population behavior (Turchin 2003). 2 Negative feedback between the realized growth rate of the population and its density is a necessary but not sufficient condition for population regulation. 3 Population dynamics are nonlinear, and exogenous (density-independent) factors may dominate population behavior. 4 A more reliable method for detecting density dependence is to plot per capita growth against N, as opposed to ln Nt+1 versus ln Nt