Download
1 / 70
710 likes | 837 Vues
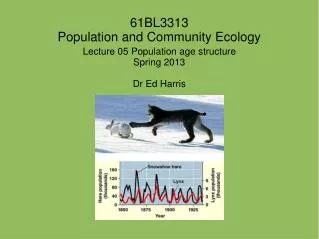
Lecture 05 Population age structure Spring 2013 Dr Ed Harris. 61BL3313 Population and Community Ecology. Announcements -lecture + tutorial announcements: -quiz 01 results -activities week next week -issues, comments?. This Time: Population age structure -intro -survivorship

E N D
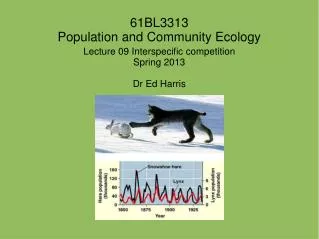
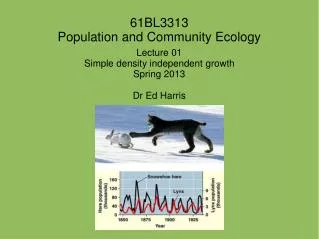
Lecture 05 Population age structure Spring 2013 Dr Ed Harris 61BL3313Population and Community Ecology
Announcements -lecture + tutorial announcements: -quiz 01 results -activities week next week -issues, comments?
This Time: Population age structure -intro -survivorship -fertility -mortality -expectation of life -net reproductive rate and intrinsic rate of increase -projecting growth with age structure -Leslie matrix -reproductive value -sensitivity analysis
Population age structure -intro -to now we have either examined populations without distinct age classes (discrete growth) -else we have specified there is a "stable distribution of ages" -we need to think about age distribution now -age dist. can itself heavily influence pop. N -age dist. can be very complex in a given pop.
Population age structure -intro -e.g., if you are interested in informing conservation of sea turtles -most effective to: -protect beaches where females lay eggs? -limit predation on eggs? -gather hatchlings and raise them for a year before releasing? -reduce mortality on adults through monitoring fishing boats?
Population age structure -intro -to answer these questions we need a systematic method to enable us to: -make different assumptions about pop. growth -estimate growth rate from basic data -to so this, ecologists use the life table
Population age structure -intro -we'll start with a simple example to help think about why pop. age structure is very important. -imagine a concert on Anglsey... (note I am really gimped to provide this example, but I shall proceed)
Population age structure -intro -during the concert a terrible catastrophe befalls Earth -most of the human population are no more, and global communication breaks down -Anglsey is somehow spared
Population age structure -intro Scenario 1: Jonas Brothers -almost all concert goers are teenage girls -a few hapless males have been forced -what happens to population growth? -after a generation?
Population age structure -intro Scenario 1: Tom Jones -who is at the concert this time?
Population age structure -intro Scenario 1: Tom Jones -who is at the concert this time? -what happens to the population -Tom Jones == extinction (well, age structure)
Population age structure -intro -a few points before we begin -life tables are actuarial – many tools here developed for human populations by the life insurance industry -problems with this technique and plant population growth -in animals, growth, reproduction, size and mortality are strongly related to age. But not so in plants (instead depend on local environment) -also vegetative reproduction, thus age class is ambiguous
Population age structure -survivorship -need to gather information on survivorship by age class -sounds simple but can be complicated to accomplish -method 1 is to follow a cohort of individuals all born at the same time until the last member of the cohort dies
Population age structure -survivorship -method 1 is to follow a cohort i. locate and mark all individuals born ii. verify when each individual dies iii. if you fail to find evidence of death, did individual emigrate? iv. best done on small pop'ns / move in predictable ways advantage – know exact age of each individual disadvantage – lacks generality // could take long time!!
Population age structure -survivorship -method 2 locate and examine all dead individuals in a population for some fixed period of time -need method to estimate age at death -assumes rates of survival are constant through time (otherwise year to year variation will be missed)
Population age structure -survivorship -method 3 collect data from several cohorts for as long as possible -most populations show a big difference between adult and juvenile survival -most labor intensive over short period
Population age structure -survivorship -need some variables for life table -age category - #number dying in the age category - # alive at the beginning of cohort - Sx is # surviving to x age class - survivorship probability lx (prop. surviving to age class x)
Population age structure -survivorship -human data from the cemetary (Fairfax, VA, US)
Population age structure -survivorship -here, lx is age specific survivorship -think of it as the probability (from birth) of living to age x -If we plot the survivorship -Sx, the number alive at age x also works
Population age structure -survivorship -we summarize survivorship usually by plotting lx as a function of age class
Population age structure -survivorship -These curves are often referred to as being one of 3 types (Pearl 1927) -Type I: death at senescence – good survivorship until old age -Type II: constant number (proportion of cohort) die at each age interval -Type III: high juvenile mortality with low adult moretality -Type III applies to most familiar organisms - why?
Population age structure -survivorship
Population age structure -survivorship
Population age structure -survivorship -as we have seen, survivorship can vary from time to time!
Population age structure -survivorship -as we have seen, survivorship can vary from time to time!
Population age structure -survivorship -as we have seen, survivorship can vary from time to time!
Population age structure fertility -denoted mx, the average number of offspring produced by the average female of a given age class x
Population age structure fertility -US female 1985 census -peak fertility? -senescence?
Population age structure fertility -US female 1985 census
Population age structure fertility Let's look at a whole "life table with lx, mx and some other stuff
Population age structure fertility Let's look at a whole "life table with lx, mx and some other stuff
Population age structure fertility Let's look at a whole "life table with lx, mx and some other stuff There are some new variables, px and qx -px is the probability of surviving to the next age class, x + 1, given that you already survived to x -calculated as: -what is p1 for the squirrels?
Population age structure fertility p1 = (l2 / l1) = 0.116 / 0.253 = 0.458
Population age structure fertility -we also have qx, which is the proportion of the population that survived to age x, but which will die in the next time interval -calculate as 1-px
Population age structure fertility - the gross reproductive rate can also be calculated; the number of offspring an individual who survives to the last age group (or the last reproductive age group) will have over its lifetime.
Population age structure fertility -GGM for gray squirrels? > GGM <- (6*2.28) + 1.28 > GGM [1] 14.96
Population age structure mortality -in mammals, the rate of mortality (# dead / 1000 for example), typically follow a "U-shaped" curve
Population age structure mortality
Population age structure mortality
Population age structure mortality -notice the spike in male mortality at young adult stages -perhaps due to male-male competition and tendency of young males to leave natal group -similar sexual dimorphism of mortality in other species too – even humans!
Population age structure expectation of life -average life expectancy ex of individuals of a given age, x -changes through life, e.g., if you live past stage with high juvenile mortality -to calculate ex, we need a few more variables (YES!)
Population age structure expectation of life -here Lx is mean survivorship assuming an organism dies halfway between age classes
Population age structure expectation of life -here Tx is is the area under the survivorship curve from age x to age w, the age at which the oldest individual dies
Population age structure expectation of life -finally ex, the expectation of life, is the number of year from age x the average individual can expect to survive to -at birth, expect to live ~2 years (lx = 0.5) -however, given having lived to age 2, you expect to live another 1.46y!
Population age structure net reproductive rate and intrinsic rate of increase back to the squirrels
Population age structure net reproductive rate and intrinsic rate of increase back to the squirrels -notice we can calculate the net reproductive rate for a generation of squirrels using the life table -here, R0 = 1.19, hence the population is predicted to grow
Population age structure net reproductive rate and intrinsic rate of increase back to the squirrels -although R is useful, we usually want to know the growth rate for a year or some other useful interval -to estimate this we can use one of the most fundamental population biology tools, the "Euler equation"
Population age structure net reproductive rate and intrinsic rate of increase back to the squirrels -however, we already have a problem for continuous breeders, as the equation relies on r, not R -never fear...
Population age structure net reproductive rate and intrinsic rate of increase back to the squirrels -however, we already have a problem for continuous breeders, as the equation relies on r, not R -never fear... <some maths happen> where G == generation time
Population age structure projecting growth with age structure -what can we do with the tools we have so far? -ultimately, the most important thing will always be predicting tomorrow based on observations in hand