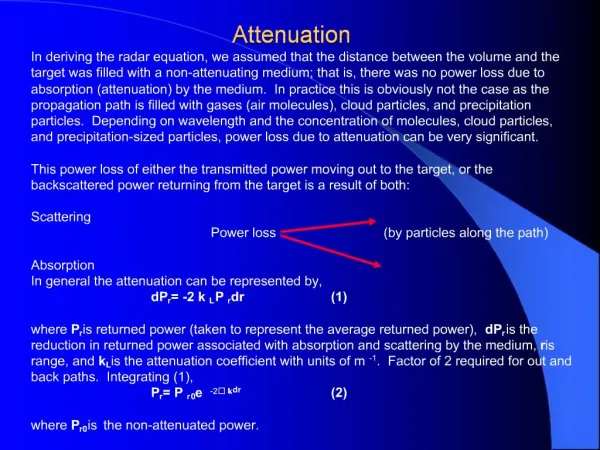
Download
1 / 12
120 likes | 316 Vues
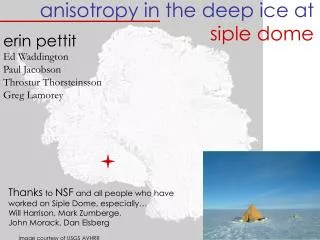
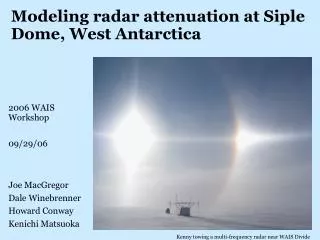
Joe MacGregor Dale Winebrenner Howard Conway Kenichi Matsuoka. Modeling radar attenuation at Siple Dome, West Antarctica. 2006 WAIS Workshop 09/29/06. Kenny towing a multi-frequency radar near WAIS Divide. Question. Where are ice-sheet beds wet?

E N D
Joe MacGregor Dale Winebrenner Howard Conway Kenichi Matsuoka Modeling radar attenuation at Siple Dome, West Antarctica 2006 WAIS Workshop 09/29/06 Kenny towing a multi-frequency radar near WAIS Divide
Question. Where are ice-sheet beds wet? Problem: We measure basal echo intensity with radar, but it’s still hard to determine if the bed is wet or dry. Why? Attenuation is not well constrained. But! Attenuation is proportional to conductivity, which is related to chemistry and temperature. So… Can we model radar attenuation using ice-core and borehole data?
How to model attenuation • Synthesize published high-frequency ice-conductivity data into a conductivity model. • Determine impurity concentrations ([H+] and [ss Cl-]) using ice-core chemistry and/or electrical measurements. • Calculate an in-situ conductivity profile using impurity concentrations and temperature and convert that profile into attenuation. • Compare model result to attenuation derived from radar profiling.
High-frequency ice conductivity • Linear dependence on concentrations of acid ([H+])and sea salt chloride ([ss Cl-]): impure ice is more conductive. • Separate Arrhenius-form temperature dependencies: warmer ice is much more conductive. • Density dependence: denser firn is more conductive. • Frequency independence in the range of 0.1 to 100 MHz.
Map of West Antarctica showing location of Siple Dome Thanks Waddington et al. (2005)!
Siple Dome impurity concentration and temperature profiles Major-ion data courtesy P. Mayewski; temperature data courtesy G. Clow.
Comparison of modeled and radar-derived attenuation at Siple Dome • Modeled attenuation rates are slightly lower. • Uncertainty in the pure ice conductivity contributes most of the uncertainty. • Possible missing physics may explain part of the discrepancy.
Possibly missing physics… • The temperatures used in the conductivity model may need to be corrected for the depression of the melting point with increasing pressure. • The ss Cl- contribution to conductivity may not be present below the eutectic point of NaCl, but this is inconsistent with the proposed ss Cl- conduction mechanism. • The acid contribution may be higher at temperatures greater than -10 oC.
Summary • We have a reasonable high-frequency ice-conductivity model for modeling attenuation. Further experiments are recommended, though, especially for the pure ice conductivity. • Modeled Siple Dome attenuation rate profile shows the large variation of attenuation rates with depth that is probably common. • There is good agreement between the modeled and radar-derived attenuation at Siple Dome (separate from the uncertainty problem).
pure H+ ss Cl-