Radar Modeling
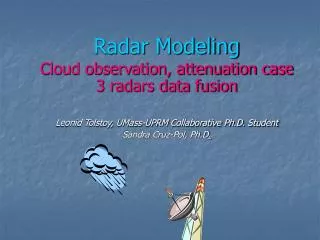
Radar Modeling. Cloud observation, attenuation case 3 radars data fusion Leonid Tolstoy, UMass-UPRM Collaborative Ph.D. Student Sandra Cruz-Pol, Ph.D . Approach. Modeled area observed by radar with parameters: Area: 100x100 pixels Beamwidth: 2 deg, Range gate width: 2 pixels

Radar Modeling
E N D
Presentation Transcript
Radar Modeling Cloud observation, attenuation case3 radars data fusion Leonid Tolstoy, UMass-UPRM Collaborative Ph.D. Student Sandra Cruz-Pol, Ph.D.
Approach Modeled area observed by radar with parameters: • Area: 100x100 pixels • Beamwidth: 2 deg, • Range gate width: 2 pixels • (1 pixel ≈ 1 km) Range Gate
Cloud and air Air area, Zair=0.1 [1/mm m3] a=0.01/4.34 dB/pixel • Cloud is modeled as a circle with radius=20 pixels, • Parameters:reflectivity: Zair=0.1 Zcloud=100attenuation: aair=0.01 Np/pixel acloud=0.3 Np/pixel Cloud area, Z=100, Alpha=0.3/4.34 dB/pixel
Attenuation • Total attenuation is calculated as a cumulative sum from the radar position at every point (range, angle)
Reflectivity in Log view • Log view (dBZ) of exact (not averaged by beam) reflectivity
Reflectivity (averaged) Radar • Averaged data , Z, within a given range-gate (radar view) • Log of averaged data, dBZ
Z seen by 3 radars • 3 radars on the corners of the square area look to the same cloud from different sides. Radars
ZdB Data fusion: Averaged data shown • Average, MAX, MIN • Log of merged data, ZdB, from all 3 radars. Radar
Max merge • Log of merged Max data from all 3 radars:at every point we select just max value. Radar
Min • Log of merged MIN data from all 3 radars:at every point we select just min value Radar
Conclusions • Averaging data from three radars looking at same cloud provides with better estimate than using max or min for data fusion. • Need to add 3rd dimension (elevation angle) • Run with different cloud/air parameter conditions.