Download
1 / 45
610 likes | 1.23k Vues
Soil and Plant Sampling and Analysis. Interpretation of lab results. Lime and fertilizer recommendations. Sampling Soil. Soil acidity. Available plant nutrients. Interpretation of lab results. Lime and fertilizer recommendations. Soil acidity. Available plant nutrients.

E N D
Interpretation of lab results Lime and fertilizer recommendations Sampling Soil Soil acidity Available plant nutrients
Interpretation of lab results Lime and fertilizer recommendations Soil acidity Available plant nutrients
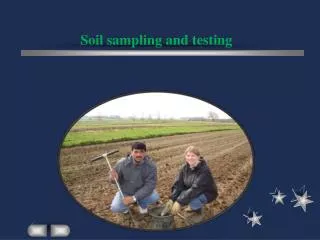
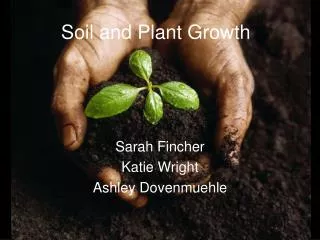
First stool leg Sampling Soil Soil acidity Available plant nutrients Interpretation of lab results
Sampling Depth Tilled Non-Tilled 3-4” 6-8”
Second stool leg Sampling Soil Soil acidity Available plant nutrients Interpretation of lab results
Target pH Most agronomic crops 6.4 Tobacco 6.6 Alfalfa 6.8
Laboratory results for Soil pH Buffer pH Water pH They measure…… Active acidity Active and Residual acidity
pH electrode - K+ Mg2+ H+ - Mg2+ K+ Ca2+ H+ H+ H+ Na+ H+ - K+ Mg2+ K+ K+ - H+ H+ Mg2+ - H+ H+ Ca2+ Ca2+ - Na+ - K+ H+ Ca2+ Mg2+ Ca2+ - 10 g soil + 10 ml water Soil pH measures Active acidity
- - B - - B - B B B + - H B - - B + B H + H + H + H soil particle + H + + H H + H + H
+ H + H soil particle + H
SMP Buffer Active and Residual acidity pH of buffer alone 7.5 x 6.8 Soil Buffer pH y 6.4 Soil Buffer pH Acidity (meq/100g) = 6.2 x (7.5 – Buffer pH)
Initial pH UK standard Sikora buffer 7.5 SMP buffer 7.5 Mehlich buffer 6.6 Adam and Evans buffer 8.0 Woodruff buffer 7.0
Third stool leg Sampling Soil Soil acidity Available plant nutrients Interpretation of lab results
Laboratory results for Phosphorus Potassium K P They measure…… Concentration of P and K in soil that is proportional to plant-available P and K
Phosphorus Adsorption Al and Fe oxides clays P P-
Precipitation of Inorganic Phosphorus Compounds at low pH (below 7) Al3+ + H2PO4- Fe-P and Al-P Fe3+ + H2PO4-
Precipitation of Inorganic Phosphorus Compounds at high pH (above 7) Ca-P Ca2+ + H2PO4-
Calcium and Magnesium Retention in Soil Ca2+ Ca2+ Mg2+ Mg2+
Extractants release a portion of nutrients into solution chemical extractant P K+ Ca2+ Mg2+
Common soil extractants Bray I (for P) Bray II (for P) Mehlich I UK standard Mehlich III Ammonium Acetate (for K)
Confusion when comparing different soil test reports because of.. different extractants different units expressing results
SOIL Extractable nutrient proportional to amount available to plant whole pie is total P or K
Comparison of 4 extractants for soil test P NAPT sample 2003-110: Rozetta silt loam from Bureau Co., IL. Soil pH = 6.5, CEC = 8.3
Comparison of 4 extractants for soil test K NAPT sample 2003-110: Rozetta silt loam from Bureau Co., IL. Soil pH = 6.5, CEC = 8.3
different units expressing results Variation in how 45 Laboratories in North America report Mehlich III Soil Test P and K • 20 labs report as mg/kg • 15 labs report as lbs/acre • 1 lab reports as lbs/acre-6 inches • 2 labs report as lbs/ppm • 2 labs report as ppm/lbs/acre • 1 lab repors an index • 3 labs reports as kg/ha • 1 lab reports as mg/L Source - NAPT, 2nd quarter 2000
UK standard for P and K Mehlich III in lbs/acre mg/kg x 2 = lbs/acre
Fourth stool leg Sampling Soil Soil acidity Available plant nutrients Interpretation of lab results
Relative Sources of Nutrients Soil Test Sufficiency Level Level soil High 100% fert. soil Med 70-100% fertilizer Low soil 50-70% soil fertilizer V.Low <50% Nutrients External available nutrients from soil required
Agronomic Threshold High Med Low 5 30 60 V.low 110 100 90 80 Yield (% of maximum) 70 60 50 40 0 1 Soil Test P (lbs/acre) Soil Test P (lbs/acre)
Environmental Threshold Limited Risk Potential Risk of P runoff of P runoff 110 100 90 80 Yield (% of maximum) 70 60 50 40 Soil Test P (lbs/acre) 400 Soil Test P (lbs/acre)
2 philosophies with a low soil test Sufficiency Agronomic Threshold 9 lb/ac P2O5 remaining in soil increases soil test 1 lb/ac Soil test P or K 4 lb/ac K2O remaining in soil increases soil test 1 lb/ac Time (years)
2 philosophies with a low soil test Rapid Build-up Agronomic Threshold Soil test P or K Time (years)
buildup maintenance sufficiency 3 philosophies with a high soil test Agronomic Threshold Soil test P or K Time (years)
Fertilizer costs for Corn Production * Data from H.J. Savoy, Univ. of Tenn.
Corn Yields * Data from H.J. Savoy, Univ. of Tenn.
Interpretation of lab results Lime and fertilizer recommendations Sampling Soil Soil acidity Available plant nutrients