SOIL SAMPLING
SOIL SAMPLING. Dr. Dave Franzen Extension Soil Specialist North Dakota State University. Relative value of soil test for nutrient need diagnosis- Nitrogen Sulfur (very low value) Phosphorus Soil pH Soil EC (soluble salts) Potassium Zinc Chloride Iron Copper Manganese Boron.

SOIL SAMPLING
E N D
Presentation Transcript
SOIL SAMPLING Dr. Dave Franzen Extension Soil Specialist North Dakota State University
Relative value of soil test for nutrient need diagnosis- Nitrogen Sulfur (very low value) Phosphorus Soil pH Soil EC (soluble salts) Potassium Zinc Chloride Iron Copper Manganese Boron
WHY SOIL TESTING? Often the best means of predicting crop response to the addition of mineral nutrient.
WHY SOIL TESTING? Relatively easy to do, cheap to analyze and timing is usually not as critical as in plant analysis.
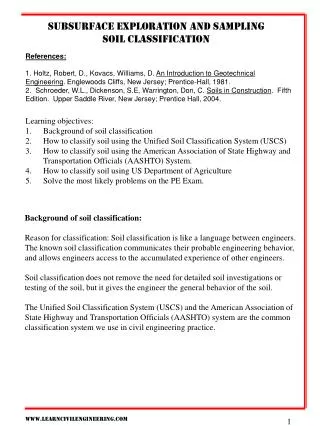
To be useful, a laboratory soil testing procedure must be correlated to a crop response (yield or quality increase) and calibrated to some quantity of nutrient addition.
Researcher must establish field trials 1. Know soil test level 2. Add incremental levels of nutrients
The “Return to N” model- Developed by John Sawyer, Iowa State and Emerson Nafziger, Illinois (2005, Proc. Ext-Ind Soil Fert. Conf.) This model is used in several corn-belt states, including Iowa, Illinois, Wisconsin, Minnesota, Ohio, and Michigan
Steps to implementation of Return to N in Wheat, or crops with quality factor- -Generate yield response data -Use regression model from data to predict yield at N rates from 0 to maximum reasonable rate. -Generate quality response data -Use regression model to predict quality at N rates -Generate gross return from each N rate -Generate cost of N from N rate - Subtract Cost of N from Gross return from N
Steps to implementation of Return to N- -Generate yield response data -Use regression model from data to predict yield at N rates from 0 to maximum reasonable rate. -Generate gross return from each N rate -Generate cost of N from N rate - Subtract Cost of N from Gross return from N
Different extractants often give different numbers, but mean the same thing if calibrated correctly. These both mean high levels of soil P Bray P1 25 ppm Olsen 15 ppm
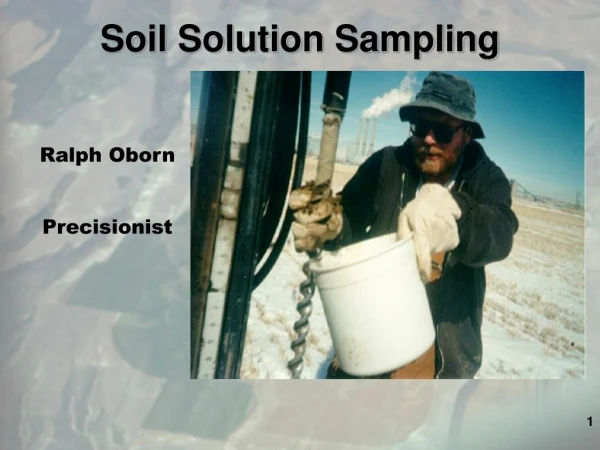
Soil Testing for Sulfur • Sample cores 0-24 inches in depth. • Composite tests may not be representative of large areas of the field. • Sample preparation may lead to overestimation of sulfur levels.
SOIL TESTING- Depth 0-6 inch - P,K, soil pH, micros 0-2 feet - nitrate, chloride, sulfate 0-2-4-6 feet – nitrate
SOIL TESTING- Technique- Automatic probes are best at depths below 6 inches Hand probes are best for surface samples
Central Tendency or Site-Specific?
Central tendency- multiple samples with average
Site-Specific Sampling Methods -Grid Sampling -Zone Sampling
SAMPLING GRID SAMPLING Grid sampling uses sufficiently dense sampling to reveal fertility patterns.
SAMPLING GRID SAMPLING 1929
SAMPLING GRID SAMPLING Wisconsin, Wollenhaupt et al., 1994 Illinois, Franzen and Peck, 1995 Wollenhaupt et al., 1997 One sample per acre (200-220 foot grid).
SAMPLING Zone sampling Zone sampling assumes that fertility patterns exist because of some logical, predicable reason.
Field trials in ND – Gardner 1994-96, Valley City 1994-04 Colfax 1995-1998, Mandan 1995-04 Hunter 1997-1998 St. Thomas 1997-00 Minot, Williston, Oakes, 2000-2004 56 whole-field site years of data. Also Malta, MT, Crookston and Renville, MN
Patterns of mobile nutrients tend to be stable between years.
Mobile Nutrients Move, But They Tend To Move To The Same Places.
How do you manage multiple years of yield data? 1994 Yield 1995 Yield 1997 Yield 1998 Yield 2000 Yield
Managing multiple yield data using rank & frequency Assign rank for each year Assign rank: 1 if > average yield 0 if = average yield -1 if < average yield
Developing Frequency Map 1994 1995 1998 2000
Yield frequency map of Illinois field using corn and soybean data compared to satellite image (right).
Soil survey Order 1 1:8,000 Order 2 1:20,000
The values of layers should be a similar scale. Images range from 0-250. EC’s might range from 0-30. Yields from 0-5 These need to be normalized in the data set before layering. Might be easiest to transform EC and Yield to 0-250.