Download
1 / 30
300 likes | 455 Vues
America’s Exhausted Paradigm: Macroeconomic Causes of the Financial Crisis & Great Recession. Thomas Palley E-mail:mail@thomaspalley.com. Thinking about the Crisis. Conventional wisdom = the crisis is due to regulatory and market failure.

E N D
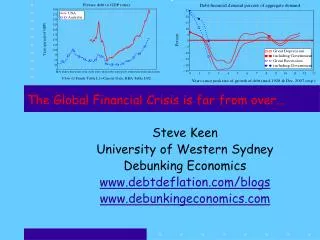
America’s Exhausted Paradigm:Macroeconomic Causes of the Financial Crisis & Great Recession Thomas Palley E-mail:mail@thomaspalley.com
Thinking about the Crisis • Conventional wisdom = the crisis is due to regulatory and market failure. • But what if the economy needed a bubble to ensure growth & full employment?
Figure 1. Macroeconomic factors and the economic crisis. Macroeconomic Factors Flawed US growth model Flawed US model of global economic engagement
US Growth Model - 1 • Old “Post WW II” growth model based on • (1) Full employment • (2) System in which wages grew with productivity • Created created a “virtuous circle” of growth • After 1980 created new growth model • (1) retreat from commitment to full-employment • (2) Severed productivity growth – wage link. • (3) Instead, relied on debt & asset price inflation to fuel demand.
US Growth Model - 2 • Features of new model visible in all business cycles post-1980 • Business cycles of Reagan, Bush pere, Clinton, & Bush fils have common features that make them remarkably simialr.
Table 1. Manufacturing employment by business cycle, Oct. 1945 – Jan. 1980.
Table 2. Manufacturing employment by business cycle, July 1980 – Dec. 2007.
Table 3. The US goods trade deficit by business cycle peaks, 1960 – 2007.
Table 5. Distribution of family income by household income rank, 1947 – 2006. Source: Mishel et al. (2008) and author’s calculations.
The Neo-liberal Policy Box Abandonment of full employment WORKERS Globalization Small Government Labor Market Flexibility
Table 6. Household debt/GDP and Non-financial corporation debt/GDP ratios by business cycle peaks, 1948 – 2007.Source: FRB Flow of Funds Accounts and author’s calculations.
Table 7. Household debt service and financial obligations as percent of disposable income (DSR) by business cycle peaks, 1981 – 2007.Source: Federal Reserve Board.
Table 8. CPI inflation and home price inflation based on the S&P/Case-Shiller National Home Price Values Index
Table 9. Personal saving rate (PSR).Source: Economic Report of the President, table B.30 (2009).
US Growth Model - 3 • New growth model intrinsically unsustainable because relies on • Squeezing incomes of workers • Squeezing household saving rates • Raising debt levels • Asset price inflation.
Flawed Global Engagement - 1 • Flawed global economic engagement policy created a “triple hemorrhage”: • Leakage of spending via imports • Leakage of jobs via offshore outsourcing and shifting of production. • Leakage of investment.
Flawed Global Engagement- 2 • (1) Replaced balanced trade with huge trade deficits. • (2) Instead of promoting exports, created a global production zone from which American firms could export to the US & from which could buy cheaper inputs.
Table 10. US goods trade balance with Mexico before & after NAFTA ($ billions)Source: Census Bureau.
Table 11. US goods trade balance ($ billions).Source: Census Bureau.
Table 12. US goods trade balance with Pacific rim countries ($ billions).Source: Census Bureau.
Table 13. US goods trade balance with China before & after PNTR ($ billions)Source: Census Bureau.
The Chickens Come Home to Roost • Post-1980 created a growth model that needed bubbles • The weaker the economy became the larger the needed bubble. • Flawed global engagement accelerated economic weakeing. • That meant we needed the mother of bubbles (housing). • Full logic took a long time to emerge & the chickens only came home to roost in last cycle.
Table 14. US manufacturing employment (millions).Source: Economic Report of the President, Table B-46 (2009).
Where Next? - 1 • Ultimate cause of the crisis is our flawed macroeconomic pradigm. • Fixing regulation & incentives can limit financial excess BUT it does not address underlying macroeconomic problem. • We need paradigm change.
Where Next? - 2 • Problem = no understanding of the problem. • Obama administration looking to maintain the system rather than change it. • Will succed in stabilizing the system but likely result will be stagnation because the paradigm is burnt out.