1 / 0

Understanding the Great Recession

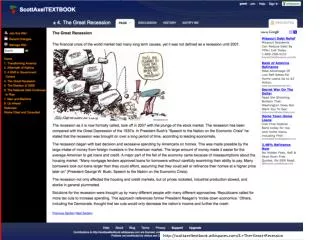
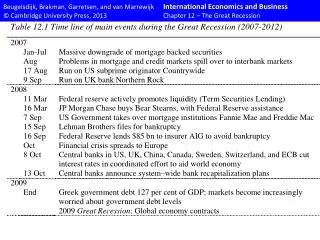
Understanding the Great Recession. Using macro to understand the current recession. Let’s analyze the history of the recession to illustrate some of the major macro issues/tools Underlying forces: Increasing leverage with lower perceived risks

kesler
Télécharger la présentation

Understanding the Great Recession

An Image/Link below is provided (as is) to download presentation Download Policy: Content on the Website is provided to you AS IS for your information and personal use and may not be sold / licensed / shared on other websites without getting consent from its author. Content is provided to you AS IS for your information and personal use only. Download presentation by click this link. While downloading, if for some reason you are not able to download a presentation, the publisher may have deleted the file from their server. During download, if you can't get a presentation, the file might be deleted by the publisher.

E N D

Presentation Transcript


  1. Understanding the Great Recession
  2. Using macro to understand the current recession Let’s analyze the history of the recession to illustrate some of the major macro issues/tools Underlying forces: Increasing leverage with lower perceived risks The housing bubble and …. not “pop” but “hissssssss” A “run on the shadow banks” and the Lehman bankruptcy The crash in asset prices in 2008 Huge decline in wealth, leading to declining housing I and C. International transmissions IS-MP curve interpretation Liquidity trap! Governmental response in monetary and fiscal policies The trough in late 2009 The long stagnation is still with us ….
  3. The bubble economy
  4. Trends in volatility of US stock prices Historical lows Note: Implied volatility is a measure of the equity price variability implied by the market prices of call options on equity futures. Historical volatility is calculated as a rolling 100-day annualized standard deviation of equity price changes. Volatilities are expressed in percent rate of change. VIX is CBOE index.
  5. Leveraging the US economy Rising leverage of US economy Source: Federal Reserve flow of funds data.
  6. Leverage for US economy Gelain et al, San Francisco Fed Working Paper.
  7. The housing price bubble Rising perceived wealth of households 1995-2006. Then catastrophic loss of wealth 2006-2009 Stabilized in last four years
  8. Then people wake up from the dream to the nightmare of falling wealth …
  9. No one saw it coming: Fed projections, June 2008
  10. A disastrous forecast = Fed forecasts = Range of all 19 participants
  11. Mortgage delinquencies skyrocket
  12. Wealth loss of $16 trillion ($140,000 per household)
  13. The impact on households and consumption
  14. Bank runs Series of bank runs. Different from earlier (Depression era) because was the run by large depositors (run on the repo). Bear Stearns and Lehman were wiped out in a week.
  15. Bank losses* * Note that US bank equity was around $1000 billion in 2010.
  16. The Lehman Bankruptcy A central event in the crisis. Market fundamentalists worried that continued bailouts would lead to “moral hazard” and worse future problems. So on September 15, 2008, government decided to let Lehman go bankrupt. Catastrophic results: - markets froze up (people could not make transactions) - stock market went down 30 % in a month and US dollar ROSE almost 20 %. - “market fundamentalism lasted only 36 hours” - then bailout of AIG, Citibank, BofA, TARP, GM, etc. “An economy in free fall” in late 2008.
  17. Risk on Mature Govt Debt (US, etc.) CDS = risk that security will default. These are US and similar Treasury bonds!
  18. A risk measure on commercial paper Source: Federal Reserve page on commercial paper. These are short-term promissory note or unsecured money market obligation, issued by prime rated commercial firms and financial companies. This shows medium-grade (A2/P2) minus top grade (AA).
  19. Policymakers respond Panic of 2008: Financial markets hysterical; paranoia everywhere about who was responsible and who should pay. Bush/Paulson: reluctantly saw that financial markets were freezing up (Bernanke key to understanding this). TARP: Started as buying toxic assets, then saw the light and recapitalized banks.
  20. Macroeconomic impacts
  21. Impact of Credit Crunch on Investment
  22. Effect on output Bear Lehman 22
  23. Macroeconomic impacts Rewrite augmented IS and MP curves as follows: IS: Y = C(Y,W) +I(rb) + G + NX(Y,Yw) Y = C(Y,W) +I(i - π + σ) + G + (X – M) MP: i = f(Y, π) rb = risky real rate = i - π + σ, where σ is the risk premium Have adverse IS shifts to W, σ, and NX from Yw Fed lowers i in standard manner, but real interest rate for businesses goes up! MP = Taylor rule
  24. Before crisis MP iff IS(i ff - π + low risk premium) i* 2006 Y
  25. After financial crisis MP iff IS(i ff - π + low risk premium) i* IS’(i ff - π + high risk premium) 2008 Y
  26. Policy Responses (thanks to Keynes’s theories) Gwendolen Darwin Raverat
  27. Financial Market Support Measures 2007-2013
  28. Unconventional Fed Measures: the Fed Balance Sheet Treasuries = normal stuff!; CPLF = commercial paper funding facility; MBS = mortgage-backed securities
  29. Fed balance sheet before and after the crisis
  30. Before Fed expansion MP iff IS’ i* 2008 Y
  31. Fed expansion MP iff IS’ i* Y 2009
  32. After TARP and other risk-reducing measures iff IS’’ MP i* 2010 Y 2009
  33. Fiscal Policy in the Liquidity Trap:Components of US stimulus legislation Source: CBO, presentation of Elmendorf, June 2009
  34. Without stimulus MP iff IS(2008) i* Y
  35. With stimulus MP iff IS(2008) IS(2010) i* Y
  36. CBO’s estimate of impact of stimulus on economy Source: CBO, presentation of Elmendorf, June 2009.
  37. CBO’s estimate of impact of stimulus on economy Actual Source: CBO, presentation of Elmendorf, June 2009.
  38. Lessons on the recent financial crisis Even with modern macro, globalized mature market economies are subject to major risks; business cycles have not disappeared. We are unlikely to reach full employment before 2016. Financial systems are inherently fragile because of their maturity and liquidity transformation (K to M). Markets cannot manage themselves. The liquidity trap is a particularly nasty outcome because monetary policy weak and fiscal policy hampered by large deficits. The US benefitted from wise leadership this time. It could have been much worse.
More Related