Download
1 / 78
780 likes | 1.01k Vues
Health Economics and Health Policy - Lessons from Japan –. Naoki Ikegami, MD, MA, PhD Dept. of Health Policy & Management Keio University School of Medicine nikegami@a5.keio.jp *Please do not distribute without authorization. Outline of Lecture. 1. General principles in health policy

E N D
Health Economics and Health Policy- Lessons from Japan – Naoki Ikegami, MD, MA, PhD Dept. of Health Policy & Management Keio University School of Medicine nikegami@a5.keio.jp *Please do not distribute without authorization
Outline of Lecture 1. General principles in health policy 2. Financing system of Japan 3. Payment system of Japan 4. Physicians and hospitals in Japan 5. Group Work: Healthcare reform in China 6. Long-term care
General principles in health policy:Why governments must take a proactive role • Better health status leads to a more productive society • Healthier workers are more productive workers • Health security leads to a more stable society • Patients and families unable to access the health services they need become desperate and angry • Patients and families who are impoverished as a result of paying medical bills become desperate and angry • Policy-makers must understand the nature of demand and supply in health care • Policy-makers and politicians tend to make decisions based on their own personal experience and convictions • How to enhance the capacity of policy-makers?
Nature of demand in health care • Demand for health care • Unpredictable: When will illness occur? How much it would cost? • Concentrated: 80% of total expenditures is used by only 20% of the patients who have high costs (80:20 rule) • Inelastic: demand is generally not affected by price • In a life or death situation (own or of family) → prepared to give up everything, sell all assets, incur heavy loans • Left to consumer choice and the market, healthcare will become the leading cause of impoverishment and social instability→ Healthcare must be provided equitably→ Government must transfer wealth from the rich to the poor • Taxes or social health insurance premiums (SHI)? • Both are difficult to levy in low and middle-income countries
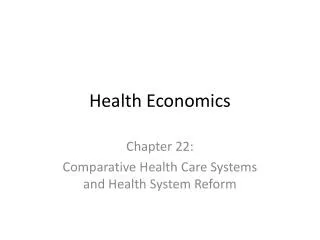
Percentage of total healthcare expenditures billed in descending order of the claim amount Japan Social Health Insurance, 1993 Top <1% of claims Bottom >75% of claims (22%) (26%) 10~25% of claims (14%) (38%) 1~10% of claims *Claims are billed every calendar month National Claims Survey, 1993, Japan, Ministry of Health & Welfare
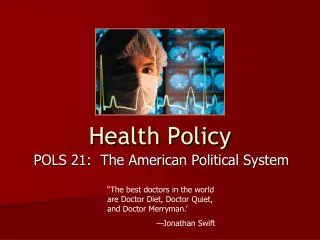
OOP financing as % of total health expenditure High out-of-pocket (OOP) payment related to greater risks of deprivation Fig 3. Catastrophic headcount against OOP financing share (OOP>25% of non-food expenditures) Source: Van Doorslaer, et al, 2007, Health Economics 16(11), P1175
Strengths and weaknesses of taxes • Strengths of tax-based system: • Progressive contribution: Rich pay more • Weaknesses of tax-based system • Unstable: tax revenue depends on the state of the economy, demands from other sectors (defense, public works etc) • Linked with government ownership of hospitals • More resources allocated to urban medical centers to which the rich have better access (regressive reallocation) • Difficult to change the budgeted amount of each hospital: Last year’s budget determines this year’s budget • Public sector tends to be inefficiently managed • Low wages of public-sector employees leads to corruption
Principles of social health insurance (SHI) • Solidarity, sense of togetherness (all in the same boat), among those enrolled • Employment-based, or community-based for self-employed • Premiums based on ability to pay, not on the individual’s risk of becoming ill • Fixed percentage of income: If 5%, then those earning $10,000 contribute $500; those earning $100,000 contribute $5,000 • Benefits the same, regardless of the premium amount • Compulsory enrollment • The healthy cannot opt out: if they can, only the sick will enroll • In comparison: Private health insurance (PHI) • Premiums are based on the individual’s previous healthcare costs: the sick pay high premiums or would not be able to enroll • The healthy pay comparatively low premiums and enjoy generous benefits • Once PHI has a significant share, difficult to expand SHI • Reason why the United States has not achieved universal coverage
Strengths and weaknesses of SHI • Strengths of SHI • Premium levels reflect benefit service levels • Possible to gradually expand the population covered • Provision of services is usually contracted out, and not directly provided by the SHI organization • Weaknesses of SHI • Solidarity only within each SHI plan → Need to subsidize (by government taxes) and/or cross-subsidize (=among SHI plans) in order to achieve equity • Benefits restricted to providers contracted by SHI • Reciprocal arrangements must be made among SHI plans so that their enrollees have access to services in other regions (portability of benefits)
Nature of supply in health care • Physician’s definition of “medical need” is relative • In comparison to the resources available • Differs according to each physician • Gray area of what constitutes “need” in health care • Depends on how physicians and hospitals are paid • Fee-for-service: Expansion in the number of patients having “need” • Tests given just to make sure: CAT scan for headaches • Medication given just in case of complications: Antibiotics for common colds • Surgical operation to reduce minor discomfort: lower back pain • Inclusive payment: Retraction in the number of patients having “need” • No CAT scan taken despite headache and sudden vomiting (high risk of tumor) • No antibiotics given for a cold despite diagnosis of bronchiectasis • No surgical operation despite major discomfort: lower back pain
What is appropriate treatment? “Appropriate" depends on: 1) Each physician’s experience: training encounters with patients etc. 2) Where the physician practices 3) How the physician is paid: fee for service or inclusive Always appropriate Sometimes appropriate Always inappropriate
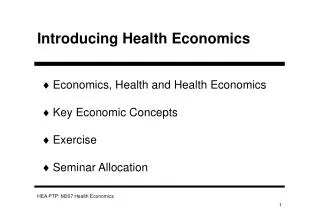
Regional differences in proportion of the population who have had an organ resected in Ontario, Canada Uterus Tonsil Gall bladder Prostate Appendix Breast Colon Maximum Mean Minimum 0 200 400 600 800 per 100,000 Reference:Vayda, E., et al, Canadian Med Assoc J, 1984
Why governments must control supply • Nature of demand: Inelastic (price is not the issue) • Nature of healthcare: Egalitarian standards • Nature of supply: Flexible • Governments must make tough decisions to provide appropriate health care at affordable costs • Flow: Controlling payment to physicians and hospitals→ Fee schedule • Stock: Regulating the number of physicians, hospitals→ Planning • Why are decisions so tough? • Costs on the demand side = Revenue for the provider side • No right answer to which all parties can agree • Flow: Average income of physicians: Should it be twice or twenty times the average worker? Hospital’s profit margin: 0% or 20%? • Stock: How many medical students to be enrolled in medical schools? How many hospitals to build? What kind of equipment to purchase?
2. Financing system of Japan Low expenditures, best health indices 1. Low health care costs: 8.0% of GDP (2005, OECD) • Low compared with other major OECD countries (20th) • Macro and micro management by government have led to decreases in expenditures in 2002, and nearly zero since 2. Basically egalitarian system with universal coverage 3. Excellent health indices • Infant mortality rate: 4 per thousand 4. No waiting lists: unrestricted access to virtually all hospitals: may have to wait but seen on same day
Healthcare expenditures, per capita PPP US$, ratio to GDP (2005) Capita, US$ PPP %GDP Source: OECD Health Data 2008, OECD (2008)
Flow of money in the Japanese healthcare system SHI Premiums: 49% Government Fee schedule: 96% National taxes: 25% Local taxes: 11% Subsidies: 4% Private-sector facilities People Public-sector facilities Directly by patient: 14% MHLW: 2005 data
Low percentage paid by patients • Universal coverage by SHI • High co-insurance rate of 30%, but: • For 90% of elderly: 10% (applicable to the elderly with incomes less than that of average worker) • For child 3 or less: 20% • Cap on co-insurance amount: If the monthly co-insurance exceeds the cap, then the co-insurance rate above the cap becomes 1% • 80:20 rule of health care costs: 80% of the total costs come from 20% of the patients → One reason why the share of patient payment is only 15% of total • Prohibition of balance billing (demand more than the fees set by SHI), and extra billing (demand payment for services not covered by SHI) • Should providers do so, then the patient must pay the entire costs, and not just the balance-billed or extra-billed amount • Patients are not at risk of impoverishment from healthcare costs
Achieving universal coverage (1) • First period: 1922-45 • Initially, pre-empt socialist movement and increase the nation’s wealth by making workers more healthy • Resistance from all sides • Employers: Resent having to pay their share of premiums • Employees: Resent having to make their contributions • Physicians: Resent lower fees set by the SHI • What carried the day: Political will of leaders • Impetus for the expansion of coverage: From the army who were concerned about the poor health of draftees, mothers as the invasion in China expanded → Need to build a warfare state
Achieving universal coverage (2) • Second period: 1945-61 • After defeat, Building a welfare statebecame the national goal • In 1955, political parties were unified on the right to the Liberal Democratic Party and on the left to the Socialist Party • Each party tried to outdo the other in their manifestos to build a welfare state • Achieving universal coverage was a common goal • Subsidies increased to community-based SHI • Universal coverage achieved in 1961 when the last municipalities started SHI • Note: Japan was a relatively poor country when the goal was • In 1952, per capita GDP was the same as in Sri Lanka at that time • Third period: 1961-1973 • Narrowing differences among enrollees, free care for elders by increasing government subsidies led by progressive prefectural governors • Fourth period: 1973- • Narrowing differences by decreasing benefits for those who had been favored
Growth in the percentage of the population covered by health insurance in Japan [Source: National Institute of Population & Social Security Research, Social Security (1997)]
Achieving equity among SHI plans:Subsidies and cross-subsidization • SHI principle: solidarity among enrollees within each plan • Those enrolled pay a fixed percentage of their income (=premium rate) • Pay according to their means, benefits according to their needs • But, income levels and ratios of elders differ among SHI plans • Average income high, % of 65+ low → Low premium rate • Average income low, % of 65+ high → High premium rate • Three mechanisms for achieving equity (1) National government subsidizes SHI plans which have enrollees with low average income (2) All SHI plans contribute to financing health care costs of elders (3) Uniform payment by the fee schedule to virtually all providers • Funding: Premiums 49%, National gov 25%, Local gov 11%, Pt 14%
Grouping of SHI plans in Japan • 1st tier: Plans having relatively high ratios of healthy and wealthy enrollees • MAA (Mutual Aid Associations) for civil servants: 78 plans • SMHI (Society-managed health insurance) for employees of large corporations: 1500 plans • 2nd tier: One plan for those in between • GMHI (Government-managed health insurance) for employees of small to medium corporations: 1 plan • 3rd tier: Plans having relatively high ratios of ill and poor enrollees • CHI (Citizens Health Insurance) for self-employed and pensioners managed by municipalities: 1820 plans • CHI for occupation-based self-employed: physicians, dentists, carpenters, barbers etc; 166 plans
(1) Adjusting to disparities in income • Provide subsidies from general tax revenue to plans that have high ratios of those with low incomes • 1st tier: No subsidies→ Expenditures financed from premiums only • 2nd tier: Subsidies amounting to 13% of benefit expenditures • 3rd tier: Subsidies on average amount to 50%, 40% for rich municipalities, up to 80% for the poor municipalities • Ratios of subsidies has been gradually increased to these levels with commensurate improvement in coverage, benefits • Subsidies instrumental in achieving universal coverage in 1961 • Co-insurance rate: CHI and dependents of other plans 50%→30% in 1973 • Cap on the co-insurance amount exceeding $300 in 1973 (cap now differs according to income: from $354 to $1,500) • Co-insurance waived for those 70+ in 1973
Flow of money in the Japanese healthcare system Employers Employees Non-employees Premiums Taxes Government GMHI SMHI CHI Government Managed Health Insurance • Central government • Small corporations Citizens’ Health Insurance • 1820 Municipalities • 166 Self-employed associations Self-employed and pensioners Society Managed Health Insurance • 1,500 Societies • Large corporations MAA Mutual Aid Associations • 78 associations • Government employees
(2) Adjusting to differences in the percentage of elders • 65-74: Cross-subsidization among plans • Upon retirement, employees leave SMHI, MAA and GMHI to join CHI • Subsidies from SMHI, MAA and GMHI to the CHI • 75+: New insurance plan implemented April, 2008 • 4th tier of SHI • 50% paid by tax, 40% by contribution from all other plans, and 10% by premium contributions from 75+ • Organized at the prefectural level • Co-insurance rate: 10% for 90% of elders, 30% for the 10% rich; threshold of cap lower (on average $354 per month)
(3) Challenges facing the SHI • Changing employment pattern: One-third of all employees are not regularly employed and are not covered by the employer-based plans • Some are covered by their spouse’s plan as a dependent if earnings are low • Those not covered should enroll in the municipal CHI, but some do not • Can reenroll in CHI by paying back one year’s amount of premiums • Public assistance will pay if individual has no income or assets • But those not enrolled tend to forgo visiting physicians • Burden of contributions to elders’ healthcare: Premium rate of some SMHI too high to be sustainable → Dissolving of SMHI→ Employees join GMHI→ Government must increase subsidies from general revenues because it finances 13% of GMHI expenditures • Rural villages: Some have 50%+ of their population 65 and over • Subsidies amounting to 80% of the CHI’s revenue still not enough • Premium rates also contained by lowering the amount subject to reinsurance • Municipalities must join the reinsurance program at the prefectural level • Amount covered by reinsurance lowered from $7,000 to $3,000per month • Government has encouraged mergers of municipalities (3,200→ 1,800)
3. Payment system of Japan • Single form of payment to all SHI plans and virtually all providers • Fully implemented in 1943, prior to achieving universal coverage in 1961 • Payment, in principle, covers for both recurrent and capital costs • Fee-for-service with some inclusive per diem payment in hospitals • Regulates not only the price of services and drugs, but also the conditions which can be reimbursed • Example of condition: Extra-office hour surcharge for physician consultation can be billed after 6 pm, irrespective of the hours set by the provider • Conditions can be set on an ad hoc basis by Ministry directorates • Single form of payment has prevented ratcheting up by providers • Ratcheting up: Price and extent of benefits negotiated by rich insurance plans or patients gradually becomes the de facto industry standard • Example: Criteria of need for CAT scans, grade of equipment, private rooms • Extra billing (billing for services not covered by SHI), and balance billing (charging more) prohibited • Providers can only bill for the amount and conditions set by fee schedule • Main exceptions: private room charges, new technology still under development
Ensuring compliance to regulations • Providers must give patients an itemized list of the services delivered at the end of each visit when they pay their co-insurance • Difficult to extra-bill or balance-bill • Peer review of claims • Claims submitted to clearing agency in each prefecture every calendar month • Review committee of peers (clinicians) established in the clearing house • If an item is judged inappropriate, then payment denied for that item • Amount denied is 1% of the total but has greater signal effects • Inspections made by a team of physicians from the government inspectorate and the local medical association • Nationally 44 full-time inspectors plus hospital physicians hired for the day • Inspections made based on information from local providers, patients, dissatisfied hospital employees etc. • Services listed in the claims matched with medical records • If not written in the medical record, then assumed that services had been billed inappropriately→ Provider must retrospectively pay back the amount billed for that service delivered in the past 6 to 12 months • If found to be fraud, physician and/or hospital’s license suspended or removed
Flow of money in the Japanese healthcare system Employers Employees Non-employees Premiums Taxes Co-insurance Government SMHI MAA CHI GMHI Fee schedule All providers
Revisions of the fee schedule • Made every two years • Implemented in April 1, when the new fiscal year starts • Revision consists of three steps • 1st Step: Global revision rate • 2nd Step: Drug and device price revision • Mostly based on survey of market price • 3rd Step: Revision of individual procedures • Each procedure fee is individually revised • 1st Step: Political decision made by prime-minister • 2nd and 3rd Step: Made by Council within the Ministry (Ministry of Health, Labor & Welfare)
1st Step: Global revision rate • Global (volume weighted for all fees and drug prices) revision rate • Because the volume of services will remain essentially the same, total expenditures can be controlled by the setting the price = the global revision rate • Government must come to a decision on the global revision rate by December because the budget for the next fiscal year starting April must be set by then • One quarter of total health expenditures financed by the national government’s general tax revenues • Reflecting fiscal austerity policy, revision rates made since 2002 have been negative. The 2002 revision rate of -2.7% led to a decrease in expenditures • Actual process of negotiations • Ministry of Finance demands a reduction • Provider organizations (Japan Medical Association etc.) demand an increase • Ministry of Health (MHLW) acts as secretariat and provides data • Politicians (Diet men) act as go-betweens • Final decision made by the prime-minister (cabinet decision), based on his evaluation of the political-economic situation
Central Social Health Insurance Council • 30 members appointed by Minister, subject to approval by Diet • 7 from providers (5 physicians, 1 dentist, 1 pharmacist) • 7 from payers (SHI plan, corporate and labor representatives) • 6 from academia • 10 specialist members (drug & device companies, nurses etc; not allowed to vote and only provide information) • Integrity rules: Two members from payers arrested for taking bribes from dentist association • Sub-committees to discuss technical aspects • Recommendations on revisions made to the MHLW Minister (early March) • MHLW publishes the revised fee schedule (late March) which is enforced from April 1, the start of fiscal year
2nd Step: Drug and device prices • Providers can buy drugs and devices in the market from wholesalers at prices lower than set by the fee schedule because of competition ⇒How to reduce excess profit of the providers? • Group purchasing has not developed as each hospital thinks it is getting the best price (as told so by the wholesalers) • Prices reduced by two methods, strengthened in 1981: • Survey of market price: wholesalers’ books etc. • Prices reduced so that new price will be only 2% greater than the volume weighted average market price of each drug • Old list price $10→Market price $9→New list price $9.02 • Downward spiral of drug prices: Cuts made every revision • Confidentiality of survey data assured to all parties • Unilateral decreases in price for new drugs selling better than projected, or for drugs that have had generics introduced • Cumulative effect: average price of pre-existing drugs one third that of 20 years ago; ratio of drug costs to total expenditures has decreased from 39% to 20% • Decreases in drug prices provides funds to increase medical service fees
Examples of drug price reductions • Pravastatin (cholesterol lowering drug) 10 mg dose • ¥163.0 (02) → (patent expires, generic introduced 03) →¥145.5 (04)→ ¥131.4 (06) → ¥124.4 (08) • The first generic introduced in 2003 priced at 80% of brand (¥163.0)→ Later, more reductions than brand • Price range of generics: ¥20-80 • Paclitaxel (cancer drug) 100 mg injection • ¥47,370 (02)→¥46,052 (04)→¥43,768 (06) →(patent expires, generic introduced 06)→ ¥39,089 (08) • Generic introduced in 2006 priced at 70% of brands (new rule) • Price of the two generics: ¥28,402 • Drug companies have blamed this downward spiral of price for the failure to develop a globally competitive industry • Short-term profits→ Incentive to develop me-too new drugs • But in the USA, the number of new drugs approved by FDA has also decreased
Setting the price of new drugs • Approval and setting price are de facto the same process • No essential drug list→ Once approved and listed on formulary, universally available • Cost-effectiveness not used as criteria for granting approval • In general, prices set relative to that of nearest existing drug • Level of innovativeness determines the range of increase • Five levels: 50-100%, 25-40%, 5-20%, 3-10%, 3% more than comparator • Ex: Price of closest existing drug is 100 Yen, 3-10% level→ Price of new is 105 Yen • Process of evaluating innovativeness has become stricter and more open • Blatant me-too new drugs no longer approved • When sales volume is projected to be small, such as for cancer drugs, then company may opt for prices to be set by using cost-based pricing method because the R&D cost per drug would not get diluted by volume • International prices also used as benchmarks • If prices are 50% higher than the average list prices in US, UK, Germany and France, then reduced • But the US drives up the price of drugs for Japan • One reason new drugs are launched first in US, and then in Japan • Unclear whether prices are higher in Japan or not • Different drugs prescribed, lower dosage but more variety • Launch prices are higher in Japan, but the decrease after patent expires is less
3rd Step: Individual fees • Negotiated in the Council based on data from two surveys conducted in the year prior to revision 1. Survey of the balance sheet of hospitals and clinics that shows which sectors are more profitable than others • Clinics, hospitals, type of hospital (acute/chronic, public/private) 2. Survey of the claims that estimates the volume for each service item • Fees individually reduced if: 1) Sector that provides the service shows profit → Example: clinics 2) Volume has expanded sharply → Indication of inappropriate use 3) Costs have decreased → Example: Material for renal dialysis • Fees may be increased if in line with policy objectives • Example: Promote separation of prescribing and dispensing • At the end of the day, all revisions must equal the revision rate and budget level set by the 1st and 2nd Steps • If increased for one procedure, then another procedure must be decreased • Survey of claims used to calculate impact of individual revisions on the total
Example of targeted cuts in fees for diagnostic imaging:MRI (Yen) Year Head BodyLimbs 2000 16,600 17,80016,900 2002 11,400 12,200 11,600 2006 10,800 if <1.5 Tesla, 12,300 if >1.5 Tesla 2008 10,800 if <1.5 Tesla, 13,000 if >1.5 Tesla
Example: Decreasing drug costs • Encourage separation of prescribing and dispensing • 40 years ago, very little separation • 1974: Fee for writing a prescription to outside pharmacy increased from 60 to 500 Yen • Gradually increased: Fee is now 680 Yen in general, and 860 Yen if prescribed for common diseases in clinics & small hospitals • Percentage of prescriptions dispensed in outside pharmacy is now 55% • Profits from dispensing reduced: Allowed mark-up following market price survey reduced from 15% (1992) to 2% (2000) • 1992: Old price: 100 Yen→ Survey 80 Yen→ Revised 95 Yen • 2000: Old price: 100 Yen→ Survey 80 Yen→ Revised 82 Yen • Reduce poly-pharmacy (prescribing multiple drugs) • Reimbursement cut by 10% across-the-board if 7 or more drugs are prescribed • Share of drugs in total medical expenditures: 39% (1981)→ 21% (2007) • Share of Japan in global drug market: 15% (2000)→ 9% (2006) • Strategy for increasing share of generics: 17.2% in 2007→ Goal is 30% • 2006: Prescription fee increased by 20 Yen if it included a generic→ failure • 2008: Pharmacists can switch to generics unless the physician prohibits • Japanese version of DRG: DPC (Diagnosis Procedure Combination)
DPC inclusive inpatient payment • Introduced initially for university hospitals in 2003, now expanded and covers half of all acute beds • Inclusive per diem rate set for 1,500 groups • Rate declines as length of stay increases: Highest rate for the shortest period • Length of stay divided into 4 periods that differs for each DPC • Inclusive fee covers only basic hospitalization, drugs, lab tests, imaging (2/3 of revenue); does NOT cover surgery etc (1/3 of revenue) • Hospital specific conversion factor: Difference between the hospital’s actual costs (if billed by fee-for-service) and the inclusive rate is compensated • Hospital revenue: [DPC rate for the group X days hospitalized for each period] X Hospital conversion factor + Fee for service items
Effects of introducing DPC • Positive aspects • Removes incentive to provide more: drugs, lab tests • Standardized payment → Standardized medical care • Deviant behavior by physicians would increase costs • Negative aspects • Quality of data • Fraud: Group patients into highest paying DPC group • Up-coding: Group inpatients in gray areas to the highest paying DPC group • Quality of care? • Economic incentives: Under-treat or refuse to admit patients who are likely to incur heavy costs such as having major co-morbidity • Just admit, diagnose into groups, not treat and discharge → Profits↑ • Effect on healthcare costs • Bed occupancy rate ↓, but daily costs ↑ • Inpatient costs ↓, but outpatient costs ↑ (Lab tests made before admission) • Whether total costs have declined or not remains in doubt
Summary of fee schedule revisions • All three steps are essentially political decisions • 1st Step: Prime-minister’s evaluation of the macro situation • 2nd Step: Arbitrary decreases made so as to provide funds for increases in key procedure fees • 3rd Step: Negotiated between MHLW officials and JMA • Negotiators have power and skill • MHLW has a division devoted to the fee schedule staffed with ten full time physicians bureaucrats • JMA has power among providers compared with hospital and specialist organizations • Has contained increases in expenditures due to advances in technology • Highest per capita number of MRI and CT at low costs, no waiting lists • Has lowered the price of drugs and the percentage of drug expenditures by regulating prices and through market competition
4. Physicians and hospitals in Japan • Laissez-faire • 80% of hospitals and 94% of clinics in private sector • Physicians are allowed to open clinics anywhere and proclaim any specialty without authorization • Authorization needed to open hospitals or expand beds (restrictions imposed after 1985, until then no limitations) • Even now, hospitals can purchase any equipment, open any specialty dept without authorization • Strict regulations • Almost all revenue controlled by the fee schedule • Physicians legally obligated to provide service to patients • Entry of investor-owned hospitals legally prohibited • Profits cannot be distributed as dividends, must be reinvested in capital
Hierarchical structure of physicians • Well-developed system of private practitioners, mainly in Chinese medicine, existed before westernization began in 1868 • System remained intact because they, and their sons, were provided with licenses • Allowed relatively good access to continue • But new entry restricted to those trained in western medicine • Parallel schools of traditional medicine that exist in China were prohibited • Hierarchical structure of medical education • Limited funds invested in University of Tokyo: German professors invited • Graduates of Tokyo University sent as faculty to other medical schools • Private, non-university level education for private schools except Keio • Remained intact until the post-World War II reforms • Allowed for affordable expansion of healthcare • But, absolute lack of well-trained physicians
Development of hospitals • Hospitals did not exist before westernization • Reliance on extended family for social support • Hospitals created for four purposes • University hospitals for medical education • Military hospitals for enlisted men • Public hospitals for infectious diseases • Private hospitals by physicians (largest ratio) • Public hospitals built by taxes, private hospitals built by private capital from revenue regulated by fee schedule • Prestigious hospitals in public sector • Private sector hospitals do not have enough resources to invest because of tight control on reimbursement • Waiting lists for some departments in some prestigious hospitals→ Patients can be referred if they do not or can not wait
Appointment of physicians in Japanese hospitals Mutual interests: medical schools wanted high quality hospitals, hospitals wanted high quality young doctors⇒ Development of closed network between university clinical departments and affiliated hospitals National Hospital University Hospital 1st Internal Med. Dept. 2nd 〃 3rd 〃 1st Surgical Dept. : : : City Hospital Red Cross Hospital Private Hospital
Basic structure of physicians and hospitals Among physicians: Vertical relationship stronger than horizontal relationship Doctors identify more with their university clinical departments than with their professional societies Among hospitals: Antagonism between high-prestige, subsidized public hospitals and generally low-prestige, unsubsidized private hospitals ⇒Concentration of power to the Japan Medical Association: Professional societies and hospital associations have less power ⇒Private practitioners focusing on primary care have higher incomes than specialists in hospitals
Lack of professional quality control • Training and accreditation of specialists under-developed → Lack of standardization • Appointment to major hospital positions: Under control of university clinical departments, credentials as specialists less important • Each university department sets its own standards • Has made it impossible to control the number of residency training positions in each specialty • Lack of standardization in hospital quality • Hospital accreditation started 12 years ago, but still less than 1/3 accredited • All hospitals inspected by local government but this is focused mainly on staffing (number of physicians, nurses to patients) and floor space per bed • Expensive equipment has been purchased without considering the following: • Has the hospital technically competent staff? • Would the hospital have sufficient volume of patients needing equipment? • Main pressure to maintain quality→ Competitive environment • Compete for patients (by grape-vine), and for physicians, nurses etc. • If unsuccessful, then goes out of business • Number of hospitals: 9,490 (96) → 8,943 (06)
Emphasis on outpatient care • Of total medical expenditures, less than half (48.5%) is inpatient care and the majority (51.5%) is outpatient • Unhindered access to virtually all hospitals • Even in university hospitals, more than one third come without any referrals • Patients are admitted from outpatient dept or ER • Most hospitals operate large outpatient dept • 1,000 bed hospital may have 4,000 outpatients per day • Even tertiary hospitals have many primary care patients • Physicians are kept busy providing outpatient care • Of the outpatient expenditures, clinics compose 60% and hospitals compose 40% • Evaluating quality more difficult in outpatient settings
Major concerns of hospital CEO • Hospital CEO must legally be a physician in Japan • Historical reasons: hospitals were built mainly by physicians • Keep the hospital in business, expand if possible: How? • Anticipate where government policy is heading by evaluating the general direction of fee schedule revisions • Adjust quickly to the fee schedule revisions • Recruit and retain physicians and nurses • Physicians: Income + high-tech facilities, equipment • Maintain good relations with university clinical departments • Nurses: Daily inpatient hospitalization fees based on staffing • More nurses per patient, higher daily rate, more income for hospital • Private sector hospitals (80%): Retain family control → Make sure child succeeds as CEO • Public sector hospitals (20%): Protect and enhance status of those who are currently employed