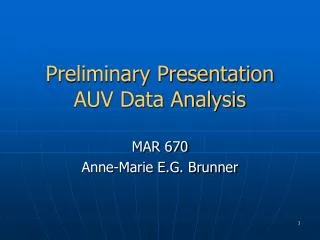
Beam Interaction Experiments at SPS: Preliminary Data Analysis
Explore the findings and analysis of tunneling processes when a high-intensity beam interacts with matter at SPS. Includes detailed experiment results, equipment damage levels, beam characteristics, and signal data from diamond detectors.

Beam Interaction Experiments at SPS: Preliminary Data Analysis
E N D
Presentation Transcript
LPROT preliminary data TE/MPE/PE EN/STI EN/MME
History • >8 yr ago. Simulations from N. Tahir and CERN pointed that a tunneling process happens when a high-intense high-dense beam interacts with matter. • Verena & Rüdiger experiment at SPS. • Couple of years ago, SPS experiment idea. • Last year, HiRadMat facility experiment request.
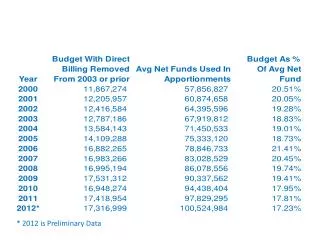
SPS material test Zinc, stainless steel, copper and INCONEL Verena Kain (2005) 11 12 • Four intensities [SPS-beam type @ 450 GeV • 1.1x0.6mm sigma]: • A=1.3x10¹², B=2.6x10¹², C=5.3x10¹², D=7.9x10¹² 16 17 The experiment confirms the 5% (2.3e12 p) equipment damage level @ 450GeV Cu plates (simulations predicts plate 18th 1st to melt)
Layout of Experimental Area Largetest object Smalltest objects • Flexible optics to provide beam radii of s = 0.1 to 2.0 mm at the focal points. • Focal point longitudinal location continuously variable between positions 1 and 3. • Predefined optics for 3 focal points and 6 beam sizes. BTV
Experiment • Target assembly done in collaboration with EN/STI • Diamond detectors + associated electronics, designed specifically for this experiment in collaboration with EG (Erich Griesmayer) • Strain gauges in collaboration with EN/MME
Phase I (22-Jun/6-Jul), Beam summary • 71 low intensity single bunch shots (2E9-1E10 p+) • 85 high intensity single bunch shots (1E11-2E11 p+) • 8 high intensity multi-bunch shots (1.5E11 p+)
Diamond detector signal 1 bunch low intensity 20dB attenuation Magenta = first diamond detector (z=40cm) Green = second diamond detector (z=50cm) Blue = third diamond detector (z=120cm)
Diamond detector linearity Detector signal versus beam intensity
Diamond detector linearity • Diamond detectors have a good linearity for a wide intensity range. • Tested different bias voltage across the detectors and its influence on the signal. • Other characteristics also understood and in process of understanding.
Multi-bunch 6 bunches 40 dB attenuation Intensity=8.47E11p+
Multi-bunch 1.9E11p+ per bunch, 6 bunches.
Multi-bunch 12 bunches 40 dB attenuation Intensity=8.32E11p+
Multi-bunch ~1.9E11p+ per bunch, 12 bunches.
Multi-bunch • Offset after second bunch of 50mV. Coming from electronics. • No signal pile-up. • No offset pile-up. • Diamond signal linear for every bunch.
Microphones Target 3 Single bunch 4.5E10 protons Beam sound
Conclusion • We were ready for phase II. • Refine beam pulse list for phase II (Tuesday 10-July)
Target 1: 2mm sigma beam (no tunneling expected) -> base shot • Target 3: 0.2mm sigma beam -> tunneling expected
Simulations 12th block 5th block 4th block Simulations: different beam size, beam intensity, Nbunches, bunch spacing.
Analysis of the data • Analyze and correct the data from the instrumentation • Update simulations with experiment parameters • Visual inspection of the target • Compare: simulations / data from experiment / visual inspection
Microphones Target 3 Single bunch 4.5E10 protons Beam sound Target 3 Single bunch 144 bunches 1.5E11 protons/bunch Beam sound