Download
1 / 89
890 likes | 984 Vues
Explore the rise of childhood obesity, impacting 37% of school-aged children, with a focus on specific communities. Uncover survey findings, prevalence rates, and the urgent need for actionable solutions in combating this health issue.

E N D
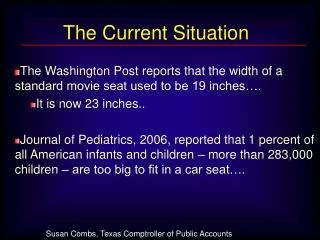
The Current Situation • The Washington Post reports that the width of a standard movie seat used to be 19 inches…. • It is now 23 inches.. • Journal of Pediatrics, 2006, reported that 1 percent of all American infants and children – more than 283,000 children – are too big to fit in a car seat…. Susan Combs, Texas Comptroller of Public Accounts
The Current Situation • Since 1970, the prevalence of obesity has doubled for preschool children • And tripled for school-aged children • Currently, 37% of school aged children are obese or overweight. Strauss RS, Pollack HA. JAMA, 2001;286:2845-8 Ogden et al JAMA 2006;295:1549-55 Margellos-Anast et al; Public Health Reports. 123;117-125
The Current Situation • With a focus on obesity alone, 19% of school aged children are obese. • Disproportionate numbers nationally: • African Americans 22% • Mexican Americans 23% • Non-Hispanic white 18% Ogden et al JAMA 2006;295:1549-55 Margellos-Anast et al; Public Health Reports. 123;117-125
The Current Situation • The Prevalence of Obesity Among Children in Six Chicago Communities • Sinai Improving Community Health Survey • Door to door, population based health survey • 501 randomly selected children aged 2-12 years • Humboldt Park Roseland • North Lawndale South Lawndale • Norwood Park West Town Margellos-Anast H, Shah AM, Whitman S. Public Health Reports. 123;117-125.
The Prevalence of Obesity Among Children in Six Chicago Communities • Three stage sample design • Communities by probability proportionate to size (PPS) sampling • Households selected at random • Household screen survey to an adult and a child/caretaker. • Survey methodology: Survey Research Laboratory of UIC Margellos-Anast H, Shah AM, Whitman S. Public Health Reports. 123;117-125.
The Prevalence of Obesity Among Children in Six Chicago Communities Percent Margellos-Anast H, Shah AM, Whitman S. Public Health Reports. 123;117-125.
The Prevalence of Obesity Among Children in Six Chicago Communities • Major findings: • Nearly half the children (aged 2 – 12) in five of six communities were obese compared to 16.8% nationally. • Prior community-level evaluations have found only 23-25% of school children were obese. • The prevalence of obesity exceeded the prevalence of overweight by a factor of four in Humboldt Park and a five in Roseland. • Contrary to what would be expected. Margellos-Anast H, Shah AM, Whitman S. Public Health Reports. 123;117-125.
The Decline in Cardiovascular Mortality Men Age Adjusted All Races; Out of hospital mortality per 100,000; NEJM, McGovern,et al, 334, 1996
The Decline in Cardiovascular MortalityWomen Age Adjusted All Races; Out of hospital mortality per 100,000; NEJM, McGovern,et al, 334, 1996
The Current Situation - CVD • While dramatic improvements in CVD mortality declines for over 40 years have been praised as one of the major health accomplishments of the twentieth century, recent data suggests that CVD mortality rate declines are slowing to 1.5% per year • Despite significant and notable declines in stroke mortality for over 60 years, stroke mortality is no longer falling. R Cooper et al. Circulation, 102, no. 25 (2000):3137-3147
The Current Situation - CVD • Two well-designed population based studies • Worchester, Mass • Olmstead County, Minnesota • have found that the rates of new cases of heart disease have not fallen from 1990 forward, and for women, may have actually risen. • More recent concerns of potentially increasing incidence of CVD and CVD mortality in men and women. Goldberg RJ et al. JACC, 33 #6 (1999); 1533-1539. Roger VL et al. Annals of Internal Med.136;#5 (2002): 34-348. Anciero et al. American J of Med;117:4 (2004):228-233. Pearson TA. Health Affairs 26;12007): 49-60
The Current Situation – Life Expectancy • The Reversal of Fortunes: Trends in County Mortality and Cross County Mortality Disparities in the US • NCHS data used to calculate life expectancy for all US counties between 1961 and 1999. • Between 1961 and 1982, life expectancy improved. • From 1983 to 1999, life expectancy declined significantly by 1.3 years for men and women in 48 counties (men) and 783 counties (women) Ezzati M, Friendman AB, et al. PLoS Med (5)4;e66, April 2008
The Current Situation – Life Expectancy • Of note, the higher disparity partly resulted from stagnation or an increase in mortality among the worst-off segment of the population, with life expectancy for approximately 4% of the male population and 19% of the female population having either had statistically significant decline or stagnation. Ezzati M, Friendman AB, et al. PLoS Med (5)4;e66, April 2008
The Decline in Cardiovascular Mortality Men Age Adjusted All Races; Out of hospital mortality per 100,000; NEJM, McGovern,et al, 334, 1996
The Apache Heart StudyIncidence ofConfirmed CAD Cases per 100,000. Ages 45 to 79. Arch Intern Med 2002;162:1368-1372.C.
ACUTE MYOCARDIAL INFARCTIONAMONG NAVAJO MEN Klain, Coulehan, Arena, & Janett, AJPH, 1988 Hospitalization rates per 1000
Acute Myocardial InfarctionsHopi Tribal Members Average values 1957-66 from Seivers and average for 1975-78 taken from Sievers and Fisher; p,0.001
INCIDENCE OF CVD The Strong Heart Study Fatal and Nonfatal Rates per 1000 person years. The Rising Tide of CVD in AI: The SHS, Circulation, 1999
American Indian/Alaska Native Mortality Rates Trends in Indian Health, 1997; Age-adjusted data
Carotid Atherosclerosis in Native Americans Roman MJ, Fabsitz RR, Crawford A, Lee ET, Fishman D, Howard BV. Circulation 1998;98(suppl):I-516
Prevalence of CVDAmong American IndiansCompared with other Groups MMWR, Vol 52, Number 47, REACH Data, Nov. 28, 2003. p 1148-1152
MMWR: The REACH Survey Among men and women in these four groups, American Indians had the highest prevalence of Cardiovascular disease… as well as obesity, current smoking and diabetes. Men had the highest rates of hypertension and high blood cholesterol levels. MMWR, Vol 52, Number 47, REACH Data, Nov. 28, 2003. p 1148-1152
Alice K. Jacobs, M.D., President American Heart Association “American Indians and Alaska Natives appear to have developed the highest rates of cardiovascular disease within the US.”
Percentage of Premature Heart Disease Deaths by Ethnicity MMWR, February 28, 2004
Percent of Death from Strokes in Those < 65 years MMWR, May 20, 2005
Disparity in Average Age of Death from Strokes MMWR, May 20, 2005
Disparities Health Staff/100,000 people AI/ANUS Gap MDs 73.9 220.6 66% lower DDS 24.0 61.861% lower Nurses 229.0 849.973% lower RPh 42.8 71.340% lower
Pathways into Health • Issues of Health & Health Education Disparities • Quality of care improved when patient and provider of same ethnicity • IOM’s study, ‘Unequal Treatment: Confronting Racial and Ethnic Disparities in Health Care’ provided a clear connection between poorer health outcomes for minorities and the shortage of minority health care providers.
Pathways into Health • Issues of Health Education Disparities • Within Arizona, only 31 American Indian students have graduated from medical school over the past two decades • Very low enrollment rates • Very high drop out rates (3 to 5 x higher)
Pathways into Health • Issues of Health Education Disparities • Native students represent only 0.3% of medical students • Only 98 Native students graduating from medical school in 2004 among 125 Medical Schools. • Only 9 Medical Schools across the nation have more than two American Indians in their graduating class. Sequist, TD. Journal of Interprofessional Care 21;(S2): 20-30
Pathways into Health • Issues of Health Education Disparities • AI/AN physicians make up only 0.002% of the total US physician workforce, • compared to 4.4% African American, 5.1% Hispanic, 73.8% White and 14.9% Asian/Native Hawaiian/Pacific Islander. Sequist, TD. Journal of Interprofessional Care 21;(S2): 20-30
Pathways into Health • Issues of Health Education Disparities “Native American students are frequently forced to endure educational environments that violate their rights to equal educational opportunity and ignore their cultural identities.” U.S. Commission on Civil Rights, “A Quiet Crisis”
Pathways into Health • Issues of Health Education Disparities • Issues related to consideration of college • Issues related to leaving reservations • Cultural requirements • Absenteeism
Pathways into Health • A focus onprofessional healthcare education for Native Americans • Built upon Academic – Tribal – Indian health collaborations • Regionalized centers of varied educational strengths • Arizona & the Southwest • Northern Rockies • Great Plains • Alaska
Pathways into Health • Objectives • To recruit and educate Native American students in health career professions • initially focusing on clinical laboratory science, followed by nursing and public health, radiology technology and subsequently pharmacy and medicine, among others. • To create an inter-professional and culturally reinforcing educational environment using traditional and innovative curricular methods. • To improve the health and health care of Native American communities by producing high quality graduates who remain in their home communities.
Pathways into Health A collaborative & integrated approach to an issue of national importance • Academic collaborators: • University of Arizona • Northern Arizona University • University of Alaska– Anchorage and Fairbanks • University of North Dakota • University of New Mexico • Arizona State University • Georgetown University • University of South Dakota • Montana State University • Harvard
Pathways into Health • Tribal collaborators: • The Hopi Tribe • The Navajo Nation • The White Mountain Apache Tribe • The Ute Mountain Ute Tribe • Pasqua Yaqui Tribe • Tohono O’odham Nation • InterTribal Council of Arizona
Pathways into Health • Further Tribal and Indian health collaborators: • Southcentral Foundation, Alaska • Ute Mountain Ute Tribe • Southern Ute Tribe • Pueblo of Zuni • Mescalero Apache Tribe • Seattle Indian Health Board
Pathways into Health • A collaborative & integrated approach to an issue of national importance… A Resolution from the National Congress of American Indians
Pathways into Health • Current Directions: • National Advisory Council • Everett Rhodes, MD, Former Director IHS (U of OK) • Bette Keltner, RN, Ph.D., Dean, Nursing, Georgetown University • H. Sally Smith, Chair, National Indian Health Board • Margaret Knght, Executive Director, Association of American Indian Physicians • John Lowe, RN, PhD, Associate Professor, Florida Atlantic University • Judy Sherman, Friends of Indian Health • George Blue Spruce, DDS, MPH, Asst Dean, Indian Affairs, Arizona School of Dentistry & Oral Health • Don Davis, MPH, Director, Phoenix Area HIS • Wayne Taylor, Chairman, Hopi Tribe • Jenny Joe, Ph.D., University of Arizona
Pathways into Health • Organizational Structure • Chairperson: Michael Allison (Navajo) • Vice Chair: Carl Fox, PhD (Montana State) • Secretary: Fred Kopacz (Alaska) • Treasurer: Sean Clendaniel, MPH (Arizona) • Executive Board • Membership • Subcommittees
Pathways into Health • Current Directions: • Development of Laboratory Science Program (Med Tech) • UND, NAU, IHS, e-HealthU Collaboration • On-site Lab Science Bachelors and Certification • Front End Workers Program • Nursing and Public Health • Radiology Technicians
Pathways into Health • Laboratory Sciences Program: • IHS and Tribal employees in multiple states • Currently employed in the laboratory • Long Term Training approval by IHS • Small Foundation Funding for Tribal Scholarships
Atlanta Begay, featured in the North Dakota Medicine, Pathways Into Health article of the Fall 2006 issue is the first student to train in CLS at UND under Pathways Into Health. Ms. Begay (top far right) is joined by other AI/AN students pursuing Health Professions education.
Pathways into HealthNative Interprofessional Development in Health Initiative Nursing and Public Health Committee
Activating the Pipeline: New Horizons in Accredited Work-Based Learning In collaboration with the Robert Wood Johnson Foundation Cruz Begay, PhD
Native Interprofessional Development in Health Initiative Initial Focus: Frontline workers • CHRs, EMTs, Health Educators, Nurses, etc. • Forefront of Indian health system • Important pipeline • Interprofessional Education • Frontline workers need to be empowered to confidently contribute to Interprofessional teams. • Students in nursing, public health, and other disciplines need preparation to work with frontline workers.
Pathways into Health • Frontline workers are an important pipeline. • AWBL may address many needs: • Place-bound adult learners. • Need for collaborative, experiential learning. • Learning that improves organizational performance. • Orientation and preparation for additional degree programs. • Credit toward degree completion or new degree. • Setting for interprofessional training • Provide Stimulus for Systems Change