Download
1 / 11
140 likes | 323 Vues
Measures of Central Tendency. Central Tendency. “Values that describe the middle, or central, characteristics of a set of data” Terms used to describe the center of a group of scores Most common score Typical score Average score. The Mode. Score that occurs most frequently

E N D
Central Tendency • “Values that describe the middle, or central, characteristics of a set of data” • Terms used to describe the center of a group of scores • Most common score • Typical score • Average score
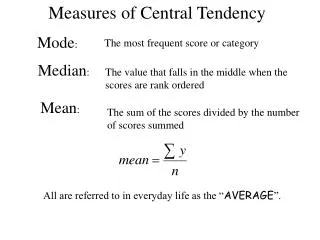
The Mode • Score that occurs most frequently • No formula to calculate • Foun by inspection • Simple frequency distribution vs. grouped frequency distribution
Advantages Easy to determine Quick estimate of the center of the group In a normal distribution it is a good description of the central tendency Can be used on an ordinal scale Disadvantages It is unstable It is a terminal statistic Completely disregards extreme scores Mode: Advantage and Disadvantages
The Median • Score associated with the 50th percentile • Middle score • Divides data set in half
The Mean • Statistical name for the average • Most commonly used measure of central tendency • Gives weight to each score according to relative distance from other scores in data set • Very sensitive • Slight change in any score will change the mean
The Mean • Advantages • Considers all information about the data • Provides basis for many other calculations • Disadvantages • See above • Outliers can skew average to the extreme score • Precision of mean should not exceed precision of data set
Calculating Mean • Rank order distribution • Simple frequency distribution
Relationship Among the Mode, Median, and Mean • With a normal distribution • All three measures fall at or near the same value • When data are skewed measures are no longer identical
Which Measure to Use? • Mode only if a rough estimate of central tendency is needed • Only when data are normally distributed • Median if: • The data are on an ordinal scale • Middle score of group is needed • Most typical score is needed • Curve is badly skewed by extreme scores
Which Measure to Use? • Mean if: • Curve is near normal , data are of interval or ratio type • All available information from the data is to be considered • Further calculations are to be made • Standard deviations • Standard scores