Small
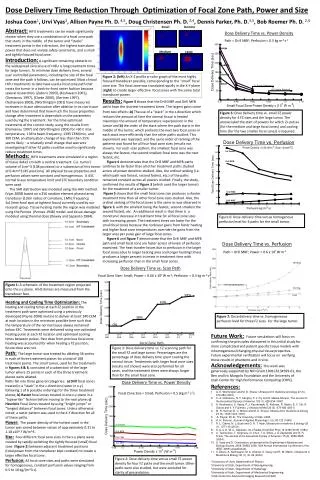
Dose Delivery Time vs. Power Density. Dose Delivery Time Reduction Through Optimization of Focal Zone Path, Power and Size Joshua Coon 1 , Urvi Vyas 2 , Allison Payne Ph. D. 4,5 , Doug Christensen Ph. D. 2,4 , Dennis Parker, Ph. D. 3,5 , Bob Roemer Ph. D. 2,4.

Small
E N D
Presentation Transcript
Dose Delivery Time vs. Power Density Dose Delivery Time Reduction Through Optimization of Focal Zone Path, Power and Size Joshua Coon1, Urvi Vyas2, Allison Payne Ph. D. 4,5, Doug Christensen Ph. D. 2,4, Dennis Parker, Ph. D.3,5, Bob Roemer Ph. D. 2,4 Path = Drill MBF; Power = 0.6 x 10⁷ W m-3 Small Domino 3000 Abstract: HIFU treatments can be made significantly shorter when they use a combination of a focal zone path that starts in the middle of the tumor and “stacks” treatment points in the z-direction, the highest transducer power that does not violate safety constraints, and a small and tightly focused focal zone. 2500 58% Medium 2000 Medium Large 63% Introduction:A significant remaining obstacle to the widespread clinical use of HIFU is long treatment times for large tumors. To minimize dose delivery time, several user controlled parameters, including the size of the focal zone and the path it follows, can be optimized. Most clinical HIFU treatments to date have used a focal zone path that treats the tumor in a back-to-front raster fashion because severalresearchers (Zederic 2003), (Keshavarzi 2001), (Damianou 1997), (Clarke 2000), (Gertner 1997), (Techavipoo 2003), (Worthington 2001) have measured increases in tissue attenuation after ablation in ex vivo tissue and have determined that how much the tissue properties change after treatment is dependant on the parameters used during the treatment. For the time optimized treatments of the current study, using the results from (Damianou 1997) and (Worthington 2002) for <60 C max temperature, 1 Mhz beam frequency, 1395 CEM/min, and 300 CEM, an attenuation change of less than than 25% seems likely – a relatively small change that warrants investigating if other FZ paths could be used to significantly reduce treatment times. 1500 NT Cooling Required 1000 38% Domino Figure 2: (left) An X-Z profile p-color graph of the most highly focused transducer possible, corresponding to the “small” focal zone size. This focal zone was translated rapidly in the X-Y plane (right) to create larger effective focal zones with the same total transducer power. Small 0% 500 0 Drill MBF Drill MFB Drill FBM Drill FMB Drill BFM Drill BMF Raster X-Z Raster X-Y Results:Figure 3 shows that the Drill MBF and Drill MFB paths have the shortest treatment times. The largest gains come from two effects: a) The use of a “stack” in the z-direction which reduces the amount of time the normal tissue is heated maximizes the amount of temperature superposition in the tumor and b) the order of the stack where the path starts in the middle of the tumor, which preheats the next two focal zones in each stack more efficiently than the other paths studied. This experiment was repeated, and the same order of ranking of the patterns wasfound for all four focal zone sizes (results not shown). For each scan pattern, the smallest focal zone was always the fastest, the second smallest focal zone was the next fastest, etc. Figure 4 demonstrates that the Drill MBF and MFB paths continue to be faster than all other treatment paths studied across all power densities studied. Also, the ordinal ranking (i.e. which path was fastest, second fastest, etc.) of the paths remained constant across all powers studied. Finally, the study,, confirmed the results of figure 3 (which used the larger tumor) for the treatment of a smaller tumor Figure 5 shows thatthe small focal zone size produces a shorter treatment time than all other focal zone sizes studied. Also, the ordinal ranking of the focal zones is the same as was observed in figure 3, with the smallest being the fastest, second smallest the second fastest, etc. An additional result is that there is a monotonic decrease in treatment time for all focal zone sizes with increasing power. The treatment times are faster for the small focal zones because the nonlinear gains from faster heating and higher focal zone temperatures override the gains from the larger area per pulse gain of large focal zones. Figure 6 and figure 7 demonstrate that the Drill MBF and MFB path and small focal zone are faster across all levels of perfusion examined. The heat transfer losses due to perfusion in the larger focal zones (due to larger heating area and longer heating times) produces a larger percent increase in treatment time with increasing perfusion than in the small focal zones. Dose Delivery Time vs. Scan Path Focal Zone Size= Small; Power = 0.66 x 10⁷ W m-3; Perfusion = 0.5 kg m-3 s-1 Methods:HIFU treatments were simulated in a region of tissue 4x4x3 cm with a central treatment (i.e. tumor) volume of 1cm^3 (108 positions) or a subsection of this tumor of 0.4cm^3 (45 positions). All physical tissue properties and perfusion values were constant and homogeneous. A 43C normal tissue temperature limit and 37C boundary condition were used. The SAR distribution was modeled using the HAS method (Vyas 2008) based on a 256 random element phased array transducer (13cm radius of curvature, 1Mhz frequency, 2x13mm focal spot at tightest focus) currently used by our research group. Tissue heating inside the region was modeled using the Pennes (Pennes 1948) model and tissue damage modeled using thermal dose (Dewey and Sapareto 1984). Figure 7: Dose delivery time vs. homogeneous perfusion level for three FZ sizes. For the large tumor. Dose Delivery Time (sec) Focal Zone Path Figure 6: Dose delivery time versus homogenous perfusion level for 4 paths for the small tumor. Path = Drill MBF; Perfusion = 0.5 kg m-3 s-1 Figure 3: Dose delivery time vs. FZ scanning path for the small FZ and large tumor. Percentages are the percentage of dose delivery time spent cooling the normal tissue. Treatments with larger focal zone sizes (results not shown) were also performed for all cases, and the treatment times were always longer than for the small focal zone. Figure 5: Dose delivery time vs. small FZ power density for 4 FZ sizes and the large tumor. The arrows label the start of powers for which 2+ pulses (for the medium and large focal zones) and cooling time (for the two smaller focal zones) is required. Figure 1: A schematic of the treatment region projected onto the x-z plane. All distances are measured from the transducer face. Heating and Cooling Time Optimization: The heating and cooling times at each FZ position in the treatment path were optimized using a previously developed (Payne 2008) routine to deliver at least 240 CEM at each location in the minimum possible time such that the temperature of the normal tissue always remained below 43C. Treatments were delivered using one optimized heating pulse at each FZ location and optimized cooling times between pulses. Past dose from previous focal zone heating was accounted for when heating a FZ position; future dose was not. Path:The large tumor was treated by ablating 36 points in each of three treatment planes for a total of 108 treatment points. The small tumor, used for the treatments in figures 4 & 6, consisted of a subsection of the large tumor where 15 points in each of the three treatment planes were ablated. Paths fall into three general categories: a) Drill focal zones treated in a “stack” in the z-direction (raster in x-y) following 1 of 6 possible orderings for the three treatment planes; b) Raster focal zones treated in one x-y plane in a “typewriter” fashion before moving to the next plane; c) Heuristic Focal Zones treated by using “knight jumps” or “longest distance” between focal zones. Unless otherwise noted, a raster pattern was used in the X-Y direction for all of these paths. Power: The power density of the hottest voxel in the tumor was varied between values of approximately 0.31 to 1.18 x10^7 W/m^3 . Size: Four different focal zone sizes in the x-y plane were created by rapidly switching the tightly focused (small) focal zone (figure 2)between adjacent treatment positions (total power from the transducer kept constant) to create a larger effective focal zone. Perfusion:All focal zone sizes and paths were simulated for homogeneous, constant perfusion values ranging from 0.5 to 10 kg/(m^3 s). Future Work: Future simulations will focus on confirming the principles discovered in this initial study for more complicated and patient specific tissue models with inhomogeneous/changing physical tissue properties. Future experimental verification will focus on verifying these results in phantoms and in vivo. Dose Delivery Time vs. Perfusion Path = Drill MBF; Power = 0.6 x 10⁷ W m-3 Acknowledgements:This work was generously supported by NIH Grant 1R01CA134599-01, the Ben and Iris Margolis Foundation and the University of Utah Center for High Performance Computing (CHPC) • References: • A. E. Worthington and M. D. Sherar, Ultrasound in medicine & biology 27 (5), 673-682 (2001). • C. A. Damianou, N. T. Sanghvi, F. J. Fry and R. Maass-Moreno, The Journal of the Acoustical Society of America 102 (1), 628-634 (1997). • A. Keshavarzi, S. Vaezy, P. J. Kaczkowski, G. Keilman, R. Martin, E. Y. Chi, R. Garcia and V. Y. Fujimoto, J Ultrasound Med 20 (5), 473-480 (2001). • M. R. Gertner, B. C. Wilson and M. D. Sherar, Ultrasound in medicine & biology 23 (9), 1395-1403 (1997). • A. Payne, Ph.D., The University of Utah, 2008. • H. H. Pennes, Journal of Applied Physiology 1 (2), 93-122 (1948). • R. L. Clarke, N. L. Bush and G. R. T. Haar, Ultrasound in medicine & biology 29 (1), 127-135 (2003). • S. A. a. D. W. C. Sapareto, Int J RadiatOncolBiol Phys 10 (0360-3016) (1984). • U. Techavipoo, T. Varghese, Q. Chen, T. A. Stiles, J. A. Zagzebski and G. R. Frank, The Journal of the Acoustical Society of America 115 (6), 2859-2865 (2004). • U. Vyas and D. Christensen, presented at the Engineering in Medicine and Biology Society, 2008. EMBS 2008. 30th Annual International Conference of the IEEE, 2008 (unpublished). • V. Zderic, A. Keshavarzi, M. A. Andrew, S. Vaezy and R. W. Martin, Ultrasound in Medicine & Biology 30 (1), 61-66 (2004). • 1University of Utah, Department of Physics • 2University of Utah, Department of Bioengineering • 3University of Utah, Department of Radiology • 4University of Utah, Department of Mechanical Engineering • 5Utah Center for Advanced Imaging Research (UCAIR) Dose Delivery Time vs. Power Density Focal Zone Size = Small; Perfusion = 0.5 (kg m-3 s-1) Figure 4: Dose delivery time versus small FZ power density for four FZ paths and the small tumor. Other paths were also studied, but were excluded for clarity of presentation.