Download
1 / 1
10 likes | 111 Vues
Explore the incorporation of stable water isotopes in global climate models using a spectral nudging technique to simulate realistic precipitation variations. Results demonstrate improved accuracy compared to free-forecast simulations.

E N D
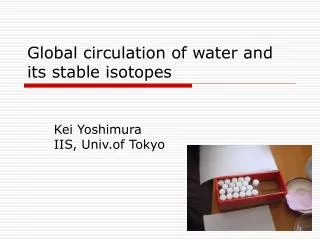
NOAA 32nd Annual Climate Diagnostics and Prediction Workshop, October 22-26, 2007, Tallahassee, FL, USA Kei YOSHIMURA1,21: Scripps Institution of Oceanography, University of California San Diego2: Institute of Industrial Science, The University of TokyoEmail: k1yoshimura@ucsd.edu, HP: http://meteora.ucsd.edu/~kyoshimura Incorporation of Stable Water Isotopes in GSM and Spectrum-Nudged 28-year Simulation Summary 3. Comparison with in-situ observations. 2. Results of Global Isotope Simulation with Spectral Nudging Stable water isotopes are incorporated into NCEP/ECPC’s global spectral model in a manner similar to other isotope models. In addition, a newly developed spectral nudging technique (Yoshimura et al., 2007) is used, which allows to reproduce the actual spatial and temporal distribution of water and isotopes distributions. Divergence, vorticity, and temperature in NCEP/NCAR Reanalysis 2 data are the base fields that are nudged for more than 1000 km scales. Specific humidity remains unnudged in order to close the water budget. A T62L28 large-scale nudging simulation for 1979-2006 has now been simulated and the results show much more realistic precipitation isotope variations in comparison to other free-forecast simulations. a. Global Climatology of SWI in Precipitation compared with GNIP data a. Typhoon event (2006/09/14-16) Right figure shows observation (GNIP), model mean by SWING, and IsoGSM annual climatology and seasonal departure (DFJ-JJA) of d18O and d-excess (dD-8*d18O) in precipitation. The model mean and IsoGSM agree quite well with lower d18O values in high latitudinal regions (“latitude effect”), in high elevation regions (“altitude effect”) and in inland region (“continent effect”). d-excess also shows good correspondence with observations. IsoGSM results Cyclonic field emerges 1. Introduction a. What are Stable Water Isotopes (SWI)? Figures: from left to right, annual climatology of precipitation d18O, its seasonal differences, annual climatology of d-excess, and its seasonal differences. From top to bottom, GNIP, Model mean, and IsoGSM results are shown. b. Global Climatology of SWI in Vapor compared with TES Observation. Right figure: dD in column vapor and the seasonal variation, and the same of d-excess. Bottom figure: Worden’s (2007) result showing the isotopic evidence of evaporation from raindrop. It is caused by kinetic fractionation processes. Right figure shows simulated result for same criteria. b. Traverse Observation over Antarctic Sea (2006/01) b. Why should SWI incorporated into GCMs? From Worden et al., 2007 c. Seasonality of SWI in Precipitation In the table below, by taking simple average of correlation coefficients of monthly d18O and its anomalies over all available sites (about 200), IsoGSM with nudging has the best number. All other models are enable to simulate seasonality of isotopic climatology, but they all failed to produce accurate interannual variability, whereas IsoGSM is capable to do so. c. What is merit of using NCEP/ECPC G-RSM? Top right figure: Correlation coefficient distributions of all monthly precipitation d18O compared with GNIP dataset for three SWING models and IsoGSM. Closer to one (blue) is better. Further right figure:Climatologic seasonality in selected GNIP observation sites (only 12 are shown among 660 sites). Precipitation of ECHAM4, IsoGSM, and observation are also shown. Right figure: The anomaly of d18O is shown. It is calculated by removing climatologic seasonality. All free forecast models have difficulty to simulate such second order variations. d. Isotopic and other physics in Iso-GSM Isotopic Physical processes Physical processes References: Majoube, J., Fractionation factor of 18O between water vapor and ice, Nature, 299, 1242, 1970. Merlivat, L., Molecular diffusivities of H216O, HD16O, and H218O in gases, J.Chim.Phys., 69, 2864-2871, 1978. Merlivat, L., and J. Jouzel, Global climatic interpretation of the deuterium oxygen 18 relationship for precipitation, J.Geophys.Res., 84, 5029-5033, 1979. Jouzel, J., and L. Merlivat, Deuterium and oxygen 18 in precipitation: modeling of the isotopic effects during snow formation, J. Geophys.Res., 89, 11749-11757, 1984. Stewart, M.K., Stable isotope fractionation due to evaporation and isotopic exchange of falling waterdrops: Applications to atmospheric processes and evaporation of lakes, J.Geophys.Res., 80, 1133-1146, 1975. Yoshimura, K. and M. Kanamitsu, Dynamical global downscaling of global reanalysis, submitted to Mon.Wea.Rev. (In revision) Acknowledgment: This research is funded by JSPS and CEC. Spectral Nudging Scheme