Download
1 / 57
580 likes | 719 Vues
Evaluation of real-time air quality and weather predictions using WRF-Chem. Steven Peckham Georg Grell, Stu McKeen, Greg Frost and Jim Wilczak NOAA/Earth Systems Research Laboratory. Motivation. NEAQS-ITCT 2004. NEAQS-ITCT 2004 AIRNow O 3 monitors (~340) AIRNow PM2.5 monitors (~120)

E N D
Evaluation of real-time air quality and weather predictions using WRF-Chem Steven Peckham Georg Grell, Stu McKeen, Greg Frost and Jim Wilczak NOAA/Earth Systems Research Laboratory
NEAQS-ITCT 2004 NEAQS-ITCT 2004 • AIRNow O3 monitors (~340) • AIRNow PM2.5 monitors (~120) • Speciation Trends Network (72 monitors) • NOAA P3 Aircraft • NOAA DC-3 Airborne Ozone Lidar • NOAA Research Vessel Ronald H. Brown RV Ronald H. Brown
NEAQS-ITCT 2004 • Regional Air Quality research • Surface AQ with above surface transport + chemistry • Local pollution vs long-range transport impacts on local AQ 2004 surface network Pink: NOAA wind profilers Yellow: Other wind profilers Red: Chemistry sites Triangles: Vertical lidars.
NEAQS-ITCT 2004 • Radiation balance • Aerosol impact upon radiation • CCN size distribution impact on cloud droplets
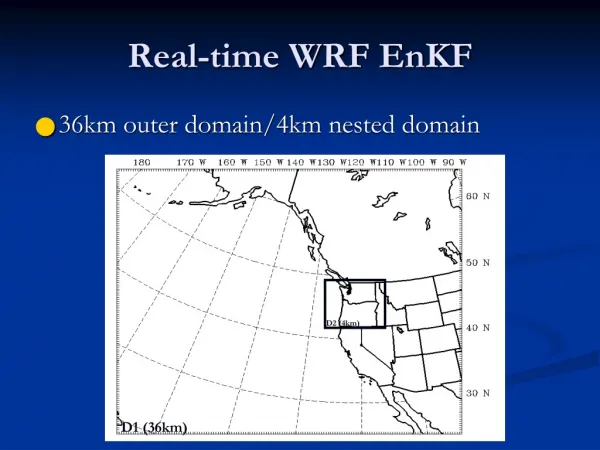
2004 Model Domain • Real-time AQ forecasts • 12-km horizontal grid spacing
Real-time AQ forecasts • 27-km horizontal grid spacing 2004 Model Domain
Real time WRF-Chem settings • Table 1. Model configuration options and parameterizations used in the WRF-Chem real-time air quality forecasts using 27-km horizontal grid spacing. • Advection scheme 5th horizontal /3rd vertical • Microphysics NCEP 3-class simple ice • Longwave radiation RRTM • Shortwave radiation Dudhia • Surface layer Monin-Obukhov (Janjic Eta) • Land-surface model RUC_LSM (Smirnova et al. 1997) • Boundary layer scheme Mellor-Yamada-Janjic 2.5 TKE • Cumulus parameterization Grell and Devenyi, 2002 • Chemistry option RADM2 (Stockwell et al. 1990) • Dry deposition Weseley, 1989 • Biogenic emissions Gunther, 1994 and Simpson, 1995 (v. 1.3) BEIS 3.11 (v 2.03) • Anthropogenic Emissions NEI 1999 v 3.0 • Photolysis option Madronich, 1987 • Aerosol option MADE/SORGAM
Real-time WRF-Chem • Visualization • RIP • IDL • ncview • Product Distribution • Web pages • FX-Net application (distributed by NOAA/ESRL)
Real time WRF-Chem • Web pages - RIP • Surface fields • MP2.5 • Surface winds • Also plots of: • Ozone, CO, etc. • Precipitation, standard pressure levels
Real time WRF-Chem • Web pages – NEAQS04 • Many standard meteorological fields • Some chemical fields
Real time WRF-Chem • FX-Net application • Current surface observations • Ozone • Particulate matter • METAR data
Real time WRF-Chem • FX-Net applications • Surface plot • WRF-Chem PM2.5 • PM2.5 observations
Real-time WRF-Chem • Statistical Analysis
CHRONOS AURAMS CMAQ/ETA-3X CMAQ/ETA-1x WRF/CHM-27km WRF/CHEM-12km BAMS -45km BAMS-15km STEM-2K3 Models Used in the ICARTT/NEAQS-2004 Evaluations Anthropogenic Emission Inventory: Model: AURAMS- 42km CHRONOS- 21km Canadian National Inv. (1990, 1995) CMAQ/ETA(1x) - 12km CMAQ/ETA(3x) - 12km(*) BAMS - 45km BAMS - 15km NEI-99, 2001, grown to 2004 WRF/CHEM-1 - 27km WRF/CHEM-2 - 27km WRF/CHEM - 12km(*) STEM(2K3) - 12 km NET-96 NEI-99 Red indicates PM2.5 forecasts available (*) Indicates a retrospective run
PM2.5 Monitors within the AIRNow network (2004) • ~120 TEOM monitors • 10 am to 6 pm LDT averages • No spatial interpolation • Log-transformed statistics for PM2.5 • Only days with complete model overlap • Only 00Z forecasts analyzed so far Fraction of data Fraction of data PM2.5 (µg/m3) O3 (ppbv)
ICARTT/NEAQS Model O3 statistics based on AIRNow data (valid September 2004) All models biased high: some very high Significance testing: WRF-Chem version 1.3 compares well in terms of correlation, but biased high due to biogenic emissions error
ICARTT/NEAQS-2K4: Comparing equivalent PM2.5 and O3 statistics (linear stats) O3 PM2.5 (log stats) WRF-Chem version 2 improves correlation, Reduced ozone bias PM2.5 ratio bias near 1! Expected ratio bias near 0.5
Summary statistics for the daytime, inland, 410-670m window Linear Scaling for O3, CO, and met. variables Blue Dashed lines: Central 2/3 of obs. Red dots and lines: Median and central 2/3 of model errors Log scaling for all other (chemistry and aerosol) PM2.5 error (Model/Obs. ratio) Median of observations Number of comparisons for each model
Summary statistics for the daytime, inland, 410-670m window AIRNOW network 342 monitors AIRNOW network 118 monitors PM2.5 error (Model/Obs. ratio)
Isoprene, PAN, and acetaldehyde forecast ratio error Isoprene error (Model/Obs. ratio) PAN error (Model/Obs. ratio) CH3CHO error (Model/Obs. ratio)
Elemental Carbon - Emissions Inventories, Model Forecasts, and Ron Brown data from ICARTT/NEAQS-2004 EPA NEI-99v3 inventory Emission rate(ng/m2/s) Model results from 7/21//04 (downwind of Boston) Observations from filter impactors - all data
Real-time WRF-Chem • Meteorological Evaluation Real-time model verification product: www.etl.noaa.gov/programs/2004/neaqs/verification
Meteorological Evaluation • Winds: • Daytime: close • Night: not too good • Temperature: • MYJ parameterization appears to be too cool • Other PBL paramterizations give different results
Real-time WRF-Chem • Diagnostic Evaluation
NOAA DC-3 Airborne Ozone Lidar (www.etl.noaa.gov/programs/2004/neaqs/verification) Observations WRF-Chem v2
NOAA DC-3 Ozone curtains; observations and models July 21, 2004 O3 ppbv Observations CMAQ/ETA-3x Model YSU PBL scheme Mellor-Yamada(2.5) PBL scheme
15-16 July 2004, forecasts starting at 1200 UTC on 15 July 2004
Inland, Daytime, 410 to 670 meter comparison Window ~4.5 hours of flight data 7/25 7/20 7/15 7/22 Other 46% 23% 17% 9% 5% 19% of flight data 20% of window between 410 and 670 m
Speciation Trends Network (STN) Aerosol Composition Comparisons SO4 NH4 NO3 Organic Carbon
Comparing SO2 oxidation extent with P3 airborne data (410-670 meter window) WRF/Chem (no SO2 cloud oxidation) underpredicts SO2 to SO4 conversion CMAQ/ETA (with SO2 cloud oxidation) overpredicts SO2 to SO4 conversion
Conclusions: AIRNow surface PM2.5 network - The benefits of O3 ensemble forecasts compared to any single model NOAA WP-3 Aircraft data - Complete analysis for each model available at http://niwot.al.noaa.gov/~stu Models show Isoprene-PAN inconsistency SO2 conversion inconsistencies with CMAQ/ETA and WRF/Chem Surface STN network Organic Carbon deficiencies NOAA Airborne O3 Lidar Illuminates the effects different PBL parameterizations
7/22/04 20:00Z to 21:20Z, O3 versus NOy minus NOx Observations CMAQ/ETA O3 (ppbv) (Observed) O3 versus NOy minus NOx slope
7/22/04 20Z to 21:20Z, CO versus NOy Observations CO (ppbv) CMAQ/ETA CO versus NOy slope (Observed)
Conclusions: AIRNow surface PM2.5 network - 5 out of 6 models show skill in predicting 8-hr afternoon averages The geometric mean ensembles improve forecasts NOAA WP-3 Aircraft data - Complete analysis for each model available at http://niwot.al.noaa.gov/~stu Models show Isoprene-PAN inconsistency NOAA WP-3 Aircraft data on 7/22 - O3 production efficiency matches observed (for most models) CO to NOy ratios shows problems with “current” inventories
PM2.5 Organic Carbon PM2.5 OC error (Model/Obs. ratio) PM2.5 Ammonium
O3 Bias Corrections needed for models to have any forecast skill Max 8 hr avg O3 Median of 342 points Skill = fraction of 342 points with RMSE(model) < RMSE(persistence) Skill inversely related to RMSE Without Bias Correction: Only BAMS models show skill 3 models with highest RMSE require ratio-adjusted bias correction in order to provide skill
O3 Photochemistry and Relevant Lifetimes O3 production is bi-catalytic in NOx, VOC Secondary PM2.5 - OH and O3 dependent SO2 + OH H2SO4 Aerosol NO2 + OH HNO3 Aerosol VOC + (OH, O3) Aerosol Lifetimes against Loss O3 12 hr PM2.5 (precip, dep.) NOy (precip, dep.) NOx 3 hr CO 30 day Isoprene .5 - 2 hr SO2 2 day, or cloud HO2 .1 - 10 min OH .1 - 15 sec NOx = NO + NO2 (Source: N2 + heat) NOy = NOx + HNO3 + PAN VOC: Biogenic: Isoprene (C5H8), Terpenes (C10H16) Anthropogenic: Alkanes, Alkenes, Aromatics
2002 New England Air Quality Study (NEAQS 2K2) NOAA Ron Brown • Focus Period: 22 - 25 July 2002 • Clear skies for most of period • Frontal passage: 7/23/02 at 18Z • 7/22/02, 7/23/02: • Big local and regional plumes • 7/24/02, 7/25/02: • Maine outflow: less polluted
NEAQS-ITCT 2004 • Intercontinental transport • Examine chemical and aerosol evolution and removal • Systematic examination of “same” air mass Polluted airmass path and proposed flight tracks
NEAQS 2002 - Example of diagnostic evaluation (Ozone production efficiency comparisons) O3 ppbv MM5-Chem MAQSIP-RT