Air Quality Forecasting Downwind from Fires Using Real-Time MODIS Data
Air Quality Forecasting Downwind from Fires Using Real-Time MODIS Data. W. M. Hao, S. P. Urbanski, J. M. Salmon, B. L. Nordgren, and S. P. Baker USDA Forest Service, Fire Sciences Laboratory Missoula, Montana

Air Quality Forecasting Downwind from Fires Using Real-Time MODIS Data
E N D
Presentation Transcript
Air Quality Forecasting Downwind from Fires Using Real-Time MODIS Data W. M. Hao, S. P. Urbanski, J. M. Salmon, B. L. Nordgren, and S. P. Baker USDA Forest Service, Fire Sciences Laboratory Missoula, Montana Notice: The materials presented here have not yet been published, and are therefore not available for citation as a reference.
Fire: unique source of atmospheric trace gases and aerosols • Major disturbance to the ecosystems • Human activities: - Land use (deforestation, shifting cultivation, fuelwood use, clearance of agricultural residues) - Land management (wildfires vs. prescribed fires) • Natural cause: lightning • Unpredictable variability: spatially and temporally • Effects: air quality, tropospheric chemistry, stratospheric chemistry, global climate, and public health
Major Factors Affecting Fire Dynamics and Smoke Emissions • Land use and management • Vegetation types • Wind, temperature and humidity • Fuel moisture content • Fuel elemental composition • Topography
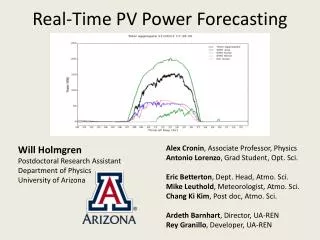
NASA Terra Satellite NASA Aqua Satellite Forest Service, RMRS, Fire Sciences Laboratory, Missoula, Montana Forest Service, Fire Sciences Laboratory • Forecast emission rates of PM 2.5 and ~15 pollutants • Every 4 hrs for the following 24 hrs • MODIS data at ~noon and 2 p.m. with 0.5-1 km resolution • FARSITE model in real-time meteorological conditions Fire Sciences Laboratory • WRF - Smoke Dispersion Model • Forecast PM2.5, O3 and ~15 pollutant levels • Downwind from fires with 12-32 km resolution • Display the forecasts on FS and NIFC web sites
June 16th, 2002 Noon Local Time MODIS Overpass: 1749 – 1801 UTC ADS Under flight: 1754 – 1819 UTC June 23rd, 2002 Noon Local Time MODIS Overpass: 1755 – 1807 UTC ADS Under flight: 1800 – 1812 UTC
Hotspots as a Proxy for Monitoring Area Burned Rodeo Fire, Arizona June 2002 Biscuit Fire, Oregon July - August 2002 Moose Fire, Montana August - September 2001
Comparison of MODIS Detected Hotspots with2002 Fire Occurrence Database
(A) a true color MODIS image (red: 0.66 mm; green: 0.55 mm; blue: 0.47 mm) acquired over areas near Hayman Fire in Colorado on July 18, 2002; (B) a false color image (red: 2.13 µm; green: 1.24 µm; blue: 1.64 µm) of the same scene; (C) the same as (B), but with the burned areas masked in yellow color; and (D) a Landsat 7 image over the same area as (A). Li et al., IEEE Transactions of Geoscience and Remote Sensing, 2004.
ρ* (apparent reflectance) = πL / µoEo • L: measured radiance of the spectral band • µo: cosine of solar zenith angle • Eo: extra-terrestrial solar flux • seven other tests on the 0.86, 1.24, 1.64, and 2.13 µm bands to filter out false alarms due to sun glint, clouds, etc. • 500 m x 500 m spatial resolution Burn Area Algorithm for MODIS DB System
● The convex hull is the shape produced by stretching a rubber band around the points. ● It consistently overestimates the burned area. ● The degree of overestimation varies, depending upon the concavity. ● The alpha shape is a generalization of the convex hull. ● The parameter alpha is adjusted to vary between the extreme cases of the point set itself and the convex hull. ● This method is used to map fresh burning when cloudy conditions obscure the wavelengths sensitive to char and ash. ● optimized distance between hotspots: 1.5 km
Fire Behavior Model - FARSITE • Fire growth and simulation model • Simulate surface fire, crown fire, spotting, post-frontal combustion, fire acceleration • Input: topography, fuels, meteorological data
Weather Research and Forecasting – Smoke Dispersion Model (WRF-SD) • WRF: next regional meteorological and forecasting model, developed by NCAR/NOAA/NCEP/AFAWA - Replacement for MM5 and NCEP eta • WRF-CHEM: WRF Model with chemistry, developed by NOAA-FSL/NCAR - Domain: 130 x130 x 31 grid cells - Regional: 16-km resolution for each horizontal grid cell - National: 32-km resolution - Anthropogenic emissions: EPA EM99v3 • WRF-SD: WRF-CHEM + emission rates from fires + plume height model, being developed by Forest Service, Fire Sciences Laboratory, Missoula, MT
Vladimir A. Kovalev, Cyle Wold, Jenny Newton and Wei Min Hao USDA Forest Service, Rocky Mountain Research Station, Fire Sciences Laboratory In Cooperation with: The Johns Hopkins University Desert Research Institute North Black Canyon Prescribed Burn 23 April 2004
Lidar Horizontal Scan of Smoke Aerosols A typical smoke plume horizontal cross section monitored by the lidar. The colored scale shows relative intensity of backscattering in arbitrary units.
Lidar Vertical Scan of Smoke Aerosols A typical smoke plume vertical cross section monitored by the lidar. The colored scale shows relative intensity of backscattering in arbitrary units.
Future Challenges • Improvement and validation of satellite measurements - Aerosol optical thickness - Active fires and burned areas: detection limit of fires in different ecosystems, understory fires, cloud cover • Development of real-time emission rates of atmospheric pollutants from fires using real-time MODIS data and FARSITE fire behavior model (12/2005) • Forecast air quality as a result of large fires by assimilation of emission rates to WRF–Smoke Dispersion Model (6/2006)
Comparison of WRF-SD predicted pollutant levels with airborne measurements of CO and other trace gas concentrations (6/2007) - COBRA Mission: Ontario and Quebec Fires, May and June 2003 - NASA INTEX-NA Mission and ICART2: Alaska Fires, June, July and August 2004 Expansion of the research region from the U.S. to North America (Canada, U.S., and Mexico) - Field experiments of biomass burning in temperate and tropical ecosystems in Mexico, 2005-2007 - Daily emission inventories of trace gases and aerosols from biomass burning in 1-km x 1-km resolution