CCGT Plant Optimisation using Real Time Data
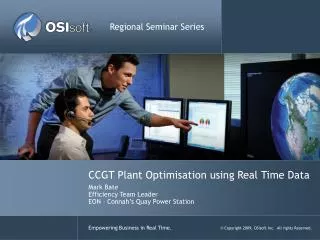
Regional Seminar Series. CCGT Plant Optimisation using Real Time Data. Mark Bate Efficiency Team Leader EON – Connah’s Quay Power Station. EON: Efficiency Targets Surpassed.

CCGT Plant Optimisation using Real Time Data
E N D
Presentation Transcript
Regional Seminar Series CCGT Plant Optimisation using Real Time Data Mark Bate Efficiency Team Leader EON – Connah’s Quay Power Station
EON: Efficiency Targets Surpassed “We beat our Efficiency target in 2007 by 2.6%. The 2008 result was >1% against target . This equates to annual CO2 savings of over 135,000 Tonnes, saving enough gas to supply the annual needs of over 50,000 homes!.” Mark Bate, EON Efficiency Team Leader Business Challenge Solution Results / Benefits • Reduce Shaftline Trips • Improve Unit Efficiencies • Reduce CO2 emissions • Performance Watchdog Displays optimise Plant • Proates models with data stored in PI • Performance Equations, ProcessBook and DataLink • ‘d4e’ Improvement project • Reduced CO2 emissions by 135k Tonnes • Efficiency increased by 0.5%. Saving £20k in lost generation! • Saving over £4m per year
Lennox Hamilton North Connah's Quay ... taking power generation forward Douglas Hamilton Liverpool Burton Point River Dee Rhyl Deeside Point of Ayr Connah's Quay Chester
Contents of Presentation • Introduction to PI and PROATES • Early development of Plant Monitoring • Introduction of a Performance Watchdog Display • Benefits of ‘d4e’ Efficiency Improvement Projects • More recent developments • Summary
Introduction to PI and PROATES • PI, ProcessBook and DataLink • allow Plant data to be interrogated post event or displayed as live values in a ProcessBook Display or Excel spreadsheet • PROATES(PROcess Analysis for Thermal Energy Systems) • reads actual Plant data from PI • performs a series of thermal calculations based on the Plant • writes the results back to PI • calculations can also be referenced to Standard Conditions. • areas of poor performance are then identified and can be rectified.
Project History • Installed in 2001 as part of Powertech Trial • Used by a few engineers • By 2003 extensive use by Operations Team • Shaftline trips, troubleshooting • Trend analysis
Development of Plant Monitoring • As the use of PI flourished… • Development of ‘real time’ displays for comparing Unit Performance • Use of ‘Multistate’ symbols on displays to act as visual alarms • Use of Datalink to create reports for various Plant performance issues (Condenser Tube Pick Report)
Performance Watchdog Display Problem with ‘GT Inlet Bleed Heating Valve’
Performance Watchdog Display • GT Air Inlet Bleed Heating Valve found open at around 8%, bleeding off warm air to the GT Air Inlet. Found out using PI Trends that this had been the case for almost 3 Days • Cycle Output increased by 7MW • Efficiency increased by 0.5% • This incident alone was estimated to have cost over £20k in lost generation! • Surely we could make use of PI Performance Equations to minimise these events and give us early warning?
Performance Watchdog Display • Digital State
Performance Watchdog Display • These PI screens helps us • maintain a 0.5% efficiency improvement on each unit, through optimising output and performance • saving of over £4m per year across the site.
Benefits of ‘d4e’ Efficiency Improvement Projects Cooling Water Systems +0.7% Gas Turbine / Compressor Improvements +0.6% • Filter upgrades and new offline wash strategy • Compressor Core Plugs fitted HRSG Pre Heater clean +0.2% • Many others….
Benefits of ‘d4e’ Efficiency Improvement Projects • In 2007 we beat our Efficiency target by 2.6% • in 2008 result was >1% against target • This equates to annual CO2 savings of over 135,000 Tonnes, • saving enough gas to supply the annual needs of over 50,000 homes!
In Summary • Continually evolving process • The PI Watchdog screens ensure we are getting the most out of the current state of the Plant at all times • We have been able to develop and enhance our monitoring • PI has given us the confidence to address areas of: • poor plant performance • carry out effective cost / benefit analysis to obtain the necessary funding • Our PI system has become an integral part of the way we operate at Connah’s Quay.