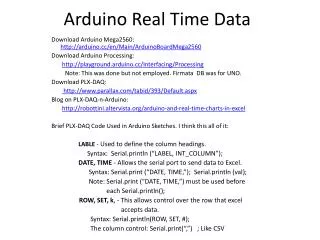
Arduino Real Time Data
Arduino Real Time Data. Download Arduino Mega2560: http://arduino.cc/en/Main/ArduinoBoardMega2560 Download Arduino Processing: http ://playground.arduino.cc/Interfacing/Processing Note: This was done but not employed. Firmata DB was for UNO. Download PLX-DAQ:

Arduino Real Time Data
E N D
Presentation Transcript
Arduino Real Time Data Download ArduinoMega2560: http://arduino.cc/en/Main/ArduinoBoardMega2560 Download Arduino Processing: http://playground.arduino.cc/Interfacing/Processing Note: This was done but not employed. Firmata DB was for UNO. Download PLX-DAQ: http://www.parallax.com/tabid/393/Default.aspx Blog on PLX-DAQ-n-Arduino: http://robottini.altervista.org/arduino-and-real-time-charts-in-excel Brief PLX-DAQ Code Used in Arduino Sketches. I think this all of it: LABLE - Used to define the column headings. Syntax: Serial.println (“LABEL, INT_COLUMN”); DATE, TIME - Allows the serial port to send data to Excel. Syntax: Serial.print (“DATE, TIME,”); Serial.println (val); Note: Serial.print (“DATE, TIME,”) must be used before each Serial.println(); ROW, SET, k, - This allows control over the row that excel accepts data. Syntax: Serial.println(ROW, SET, #); The column control: Serial.print(“,”) ; Like CSV
Short Ardunio Script Placing Arduino Reads into Excel Meter OpenDocument Text Double click to open, 233 line sketch, reading analog pins A(15:0] and sending it to ECEL. Need win2k or better. 14 bit decode of up/dwn counters to display CLK, and write A5A5 to nibs 7:4 and read that into nibs 3:0. Use bench_mon.xlsm found in plx. NOTES: The Arduino code writes to columns 1-3 (A-C) and ECEL maps columns B to G and to C to I .Column A is the “DATA, TIME, “ This is needed to have EXCEL read the incoming data. 8 Nibs can be read or written: pic shows a write of A5A5 and reading same. The value to R/W is CSV file read by script. The frequency will be the decode of up/down counters used to generate CLOCK with base frequency of either 10 or 20 MHZ crystal module and I really need the “BOX” to finish this. Reads of 12 analog ports with wait of 5mS B/W reads plus 40mS at end of reads allows about 10 reads/s. The box colors are based on the data received , set in EXCEL. Supply : 0<=5V consider a 5% de-rating. Supply >5v are a 10% de-rating. All values read outside their de-rating show RED. The voltages monitored were 5V, 3.3V and 0V and the one pot V- OUT seen in the V-V supply where the color green/red was base on value V>= 0 = green and anything else is red. All current values were tied to 0V where 0-0.9 = green and any measurement above or below this range is red. The Measured value has no constraints and will always be green. Must! open xcel to blank sheet. Connect to data port then move meter sheet to first page (blank out Meter). ECEL Snapshot
EXCEL Data Sheet Used This is the excel DB used. The DATE,TIME, field A1 , measured value 1-2=B2-3. You must use the downloaded excel worksheet it contains VB code that allows Aduino access, or this one. Sheet : bench_mon2.xlsm.
ARDUINO & PROCESSING Download Processing: http://processing.org Download Arduino Processing: http://playground.arduino.cc/Interfacing/Processing Copy folder arduino to processing folder C:\downloads\processing-2.0.1-windows32\processing-2.0.1\modes\java\libraries Enter processing and add font: “Arial-BoldMT-14”, <Tools><Create Font> Add sketch box_proc_pde.txt making the box. Click R-W to change the 32 bit bus status. Click Log to allow data log.
Change The 32 Bit Bus The meter will default to all read: r,r,r,r,r,r,r,r . Click R-W and the box below will pop-up, make your entry and cliclk OK. The board is currently wired upper 2 bytes to the lower 2 bytes, so it will read what it writes.
Data Log Click the Log button and the box below will pop-up suggesting a file name of the current date and time. Accept it or change to your preference. This will write out a CSV file containing the measurements and settings of the box.
Summary of Box Details Listing Ports Used and the Data TransievedWould Like to Employ SPLC780D 40X4 LCD Display