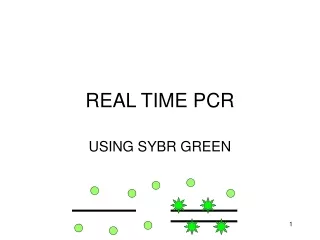
Real Time RT PCR Data Analysis
Real Time RT PCR Data Analysis. Broad and Long Term Objective.


Real Time RT PCR Data Analysis
E N D
Presentation Transcript
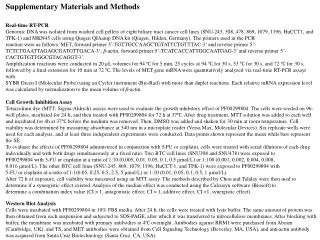
Broad and Long Term Objective To characterize the expression of ribulose 1-5 bisphosphate carboxylase oxygenase and chlorophyll AB binding gene in Lycopersicon esculentum (Tomato) leaves subjected to either 48 or 72 hours in the dark as compared to the expression in leaves grown under normal 12 hr light/dark cycle and harvested at noon.
Research Plan RNA Isolation leaf material grown in light and in the dark RNA Electrophoresis and cDNA synthesis RBCS3 and Cab-1b transcript quantitation by real time PCR Analysis of real time PCR data
Today’s Laboratory Objectives 1. To learn how to interpret real time PCR data. Melt Curve Analysis Analysis of Cycle Thresholds Calculating Relative Fold Change using the 2ΔCt method 2. To interpret real time RT PCR data and draw meaningful conclusions: ie, determine the relativequantitation of RBCS3 or Cab-1b transcript levels in light- vs. dark-grown tomato plants
RubisCO Small Subunit accession #X05986 Coding Sequence 1 aaaaatgaaa aactcgtcag aaagaaaaag caaaagcaac aaaaaaattg caagtatttt 61 ttaaaaaaga aaaaaaaaac atatcttgtt tgtcagtatg ggaagtttga gataaggacg 121 agtgaggggt taaaattcag tggccattga ttttgtaatg ccaagaacca caaaatccaa 181 tggttaccat tcctgtaaga tgaggtttgc taactctttt tgtccgttag ataggaagcc 241 ttatcactat atatacaagg cgtcctaata acctcttagt aaccaattat ttcagcaatg 301 gcttcttcag taatgtcctc agcagctgtt gccacccgcg gcaatggtgc acaagctagc 361 atggttgcac ccttcactgg actcaagtcc accgcttctt tccctgtttc aaggaagcaa 421 aaccttgaca ttacctccat tgctagcaac ggtggaagag tcagttgcat gcaggtttgt 481 gtgtgtatat atatatacgt acaacaaaat tcattgacta taatgttata ctcgattagc 541 taatttaact atttataatt gtataggtgt ggccaccaat taacatgaag aagtacgaga 601 ctctgtcgtaccttcctgatttgtccgacg agcaattgct cagcgaaatt gagtacctat 661 tgaaaaatggatgggttccttgcttggaat tcgagactga ggtcaacatc tatctcctct 721 gtttttaaaa tttactagct agtatgttga tatgtcgtgt taacagtgtt gtgggatatc 781 atgtgcagca cggatttgtg taccgtgaga accataagtc accaggatac tacgatggca 841 gatactggaccatgtggaag ttgcccatgt tcgggtgcactgatgcaacccaggtcttgg 901 ctgaggtgca ggaggcaaag aaggcttacc cacaggcatg ggtccgtatc atcggattcg 961 acaatgttcg tcaagtgcag tgcatcagtt tcatcgctta caagcccgaa ggatactaaa 1021 tgtgtatatg tcaacagtga gaaactgttc gcattttccg ttttgcttct ttctttctat 1081 tcaatgtatg ttgttggatt ccagttgaat ttattatgag aactaataat aatagtaata 1141 atcatttgtt tctttactaa tttgcatttt cacatatgat ttctggtgca tatcataatt 1201 ttcattccac caatattaat ttccccattc aagttactta tgaaatagaa atcctcttct 1261 ccgactactt tatttgtccg aaagtcttgt ggctgctata taacgcaaaa tggatagaga 1321 agattcatta ctaagccgat c
RubisCO Primer Sets StartLengthTm%G+CSeq Primer Set A Left Primer 276 20 60.69 45 AAATGGATGGGTTCCTTGCT Right Primer 422 20 59.58 50 AAGACCTGGGTTGCATCAGT Product Size: 147 Primer Set B: Left Primer 216 22 59.87 50 GTCGTACCTTCCTGATTTGTCC Right Primer 375 20 59.96 55 GGTCCAGTATCTGCCATCGT Product Size: 160
Chlorophyll A/B Binding Protein (CAB-1b) Accession # M14443 Coding Sequence 1 atgaagaagt tgatggatta tagattgcca agtgtgctac acatgggatc ttgataccca 61 atgagatcat acatatagat atcacttgat aagatgattc tctctctttt ctcctatata 121 ttctcaaccc caactaactt catcttcatc acccatcaaa cacttaattc ttctcttaaa 181 ataaacacaa atggcagctg ctacaatggc tctttcttcc ccttcatttg ctggacaggc 241 agtcaaactctcaccatctgcctcagaaat ttctggaaat ggaaggatca ctatgagaaa 301 ggctgttgcc aagtccgccc catctagcag cccatggtat ggccctgacc gtgttaagta 361 cttgggccca ttctctggtg agtccccaag ctacttgacc ggtgaatttcctggtgatta 421 cgggtgggat accgctggac tttcagcaga ccctgaaact tttgccaaga accgtgaact 481 tgaagtgatc cactgcagat gggctatgct tggtgctctt ggatgtgtct tccctgagct 541 cttggcccgt aatggtgtca agttcggtga ggctgtgtgg ttcaaggccg gatcccagat 601 cttcagtgaa ggtggacttg actacttggg caacccaagc ttggtccatg cacaaagcat 661 cttggccatc tgggcttgcc aagttgtgtt gatgggagct gttgagggtt accgtattgc 721 tggtggacct cttggtgagg ttgtcgaccc actctaccct ggtggcagct tcgacccatt 781 aggccttgct gaagacccag aggcatttgc tgagctcaag gtaaaggaga tcaagaacgg 841 tagacttgct atgttctcta tgtttggatt ctttgttcaa gctattgtca ccggaaaggg 901 tccattggag aaccttgctg atcaccttgc agaccccgta aacaacaatg cctgggcttt 961 cgccacaaac tttgtccccg gaaaatgact ctaaacgtct caagtcttgg tcgtttgatg 1021 acagtgtaaa gatgtagtgt gctacctgac aatataatga aattttgttt gtgtttgaat 1081 ggcttttctg tactgagttt cattttccca agtcaactca taaatcaagc actaacaatg 1141 atacaacaaa atgacccctc acatatgagt aataactaga aaaactgcaa tgctatgttg 1201 taaggttgaa cttgaatttt caactagagc agtttattta atttaatgaa ttc
Chlorophyll A/B Binding Protein Primer Set StartLengthTm%G+CSeq Primer Set A Left Primer 55 21 59.86 47.62 AAACTCTCAACCATCTGCCTCA Right Primer 236 20 60.74 50 CACCCGTAATCACCAGGA Product Size: 147
Real Time RT PCR Cycling Parameters Polymerase activation 95° C 10 min 40 cycles Denaturation 95° C 60 sec Primer Annealing 60° C 30 sec Extension 72˚ C 45 sec Melt Curves Denaturation 95° C 1 min Renaturation 55° C 1 min Denaturation Ramp 0.5° C every 10 sec
Defining Parameters ofReal Time RT PCR Cycle Threshold: Cycle # when product fluoresence exceeds that of background Fold Change: 2ΔCt Melt Curve: fluorescence plotted as a function of temperature as thermal cycler heats through dissociate temperature of product
Data Analysis Work Flow Extract Amp Plots, Melt Curve and Raw Data using ICycler Software Examine Data OPD File containing Data Output NTC Melt Curve Amp Plots Excel Data Analysis Data Presentation and Interpretation
NTC Controls NTC’s- Negative Control Rxn with Primers but without Template • Examine Amp Plots to determine whether or not you have any amplification products. • The presence of an amplication product is indicative of contamination • Sources of contamination: water, primers, SYBR Green Master Mix, Pipets, etc
Melt Curve Analysis Melt Curve used to Assess Specificity of Rxn • Do you have a single amplification peak or multiple amplification peaks? • Single Peak= Single Product • Multiple Peaks= Multiple Products • What is the peak melt temperature and how does this correlate with the expected melt peak temperature? • To further verify that you have amplified correct product can sequence amplification product
Output data: Melt curve* Gradual temperature- dependent fluorescence quenching Rapid decrease in fluorescence caused by denaturation of dsDNA (PCR product) Melt peak (85.5º C) Relative fluorescence units Negative first derivative of fluorescence/temperature
Identification of multiple PCR products using a melt curve product 2 (Tm 86.9º C) primer dimer (Tm 77.0º C) product 1 (Tm 85.5º C) Under identical solvent conditions, Tm is determined by G/C content and length of dsDNA
Output data: Amplification plot* C1 Ct Table* B1 Ct Identifier Etc. Threshold Relative fluorescence units
Output data: Amplification plot Wednesday Lab, Group #9
Relative Quantitation of Transcript Levels* • Determine average Ct for each treatment (light, dark) • ± standard deviation • Determine ΔCt |Ct dark – Ct light| • Calculate relative difference in transcript levels between • samples (2ΔCt) • Make a histogram to describe the relative difference in • transcript abundance between light • and dark samples • Caveats: • Amplification efficiency is rarely 2 • Genomic DNA contamination
Presentation of Real Time RT PCR Data What to include: • Melt Curve • Raw Quantitative Graph • Histogram of Relative Fold Change