Supplementary Materials and Methods Real-time RT-PCR
70 likes | 250 Vues
Supplementary Materials and Methods Real-time RT-PCR

Supplementary Materials and Methods Real-time RT-PCR
E N D
Presentation Transcript
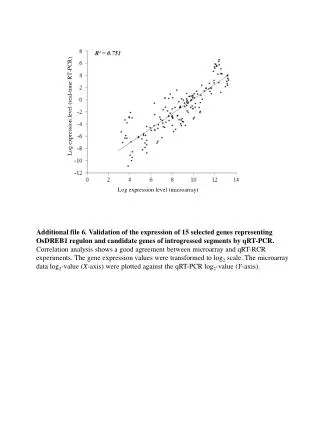
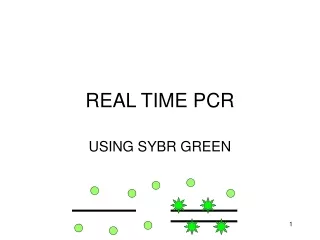
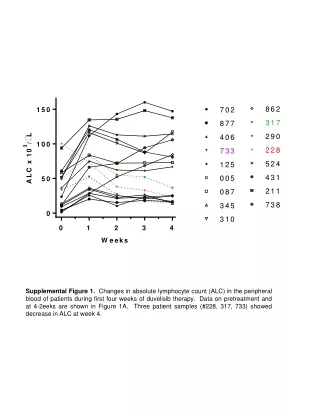
Supplementary Materials and Methods Real-time RT-PCR Genomic DNA was isolated from washed cell pellets of eight biliary tract cancer cell lines (SNU-245, 308, 478, 869, 1079, 1196, HuCCT1, and TFK-1) and MKN45 cells using Qiagen QIAamp DNA kit (Qiagen, Hilden, Germany). The primers used in the PCR reaction were as follows: MET, forward primer 5’-TGTTGCCAAGCTGTATTCTGTTTAC-3’ and reverse primer 5’-TCTCTGAATTAGAGCGATGTTGACA-3’; β-actin, forward primer 5’-TCATCACCATTGGCAATGAG-3’ and reverse primer 5’-CACTGTGTTGGCGTACAGGT-3’. Amplification reactions were conducted in 20 µL volumes for 94 ℃ for 5 min, 25 cycles at 94 ℃ for 30 s, 53 ℃ for 30 s, and 72 ℃ for 30 s, followed by a final extension for 10 min at 72 ℃. The levels of MET gene mRNA were quantitatively analyzed via real-time RT-PCR assays with SYBR Green I (Molecular Probe) using an Cycler instrument (Bio-Rad) with more than duplet reactions. Each relative mRNA expression level was calculated by normalization to the mean volume of β-actin. Cell Growth Inhibition Assay Tetrazolium dye (MTT; Sigma-Aldrich) assays were used to evaluate the growth inhibitory effect of PF00299804. The cells were seeded on 96-well plates, incubated for 24 h, and then treated with PF00299804 for 72 h at 37℃. After drug treatment, MTT solution was added to each well and incubated for 4h at 37℃ before the medium was removed. Then, DMSO was added and shaken for 30 min at room temperature. Cell viability was determined by measuring absorbance at 540 nm in a microplate reader (Versa Max, Molecular Devices). Six replicate wells were used for each analysis, and at least three independent experiments were conducted. Data points shown represent the mean while bars represent the SE. To evaluate the effects of PF00299804 administered in conjunction with 5-FU or cisplatin, cells were treated with serial dilutions of each drug individually and with both drugs simultaneously at a fixed ratio. Two BTC cell lines (SNU308 and SNU478) were exposed to PF00299804 with 5-FU or cisplatin at a ratio of 1:10 (0.005, 0.01, 0.05, 0.1, 0.5 μmol/L) or 1:100 (0.001, 0.002, 0.004, 0.008, 0.016 μmol/L). The other BTC cell lines (SNU-245, 869, 1079, 1196, HuCCT-1, and TFK-1) were exposed to PF00299804 with 5-FU or cisplatin at a ratio of 1:1(0.05, 0.25, 0.5, 2.5, 5 μmol/L) or 1:10 (0.01, 0.05, 0.1, 0.5, 1 μmol/L). After 72 h of exposure, cell viability was measured using an MTT assay. The methods described by Chou and Talalay were then used to determine if a synergistic effect existed. Analysis of the median effect was conducted using the Calcusyn software (Biosoft) to determine a combination index value (CI > 1, antagonistic effect; CI = 1, additive effect; CI <1, synergistic effect). Western Blot Analysis Cells were incubated with PF00299804 in 10% FBS media. After 24 h, the cells were treated with lysis buffer. The same amount of protein was then obtained from each suspension and subjected to SDS-PAGE, after which it was transferred to nitrocellulose membranes. After blocking with buffer, the membrane was incubated with primary antibodies at 4℃ overnight. Antibodies against RRM1 were purchased from Abcam (Cambridge, UK), and TS, and MET antibodies were obtained from Cell Signaling Technology (Beverley, MA, USA), and anti-actin antibody was acquired from Santa Cruz Biotechnology (Santa Cruz, CA, USA).
Supplementary figure 1 SNU 478 SNU 869 PF00299804 PF00299804 C C RRM1 Actin Supplementary Figure 1. RRM1 downregulation by PF00299804 treatment in SNU478 cells. SNU478 and SNU869 cell lines were treated with increasing doses of PF00299804 (0.01, 0.1, 1 μmol/L) for 24h, after which the extracts were immunoblotted with RRM1 antibodies.
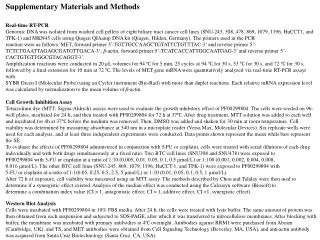
Supplementary figure 2 MKN45 (MET amp) SNU1079 SNU1196 HuCCT-1 TFK-1 SNU245 SNU308 SNU478 SNU869 MET Actin Fold MET amplification Supplementary Figure 2. Fold MET amplification in BTC cell lines. Protein expression level of MET was analyzed by immunoblotting in BTC cell lines and MET amplified MKN45 gastric cancer cell line (positive control; upper). Fold MET amplification was analyzed in genomic DNA isolated from BTC cell lines and MKN45 cells by real-time PCR(bottom).
Supplementary figure 3 SNU 308 SNU 478 SNU1079 PF00299804 PF00299804 PF00299804 C C C TS Actin Supplementary Figure 3. TS downregulation by PF00299804 treatment. SNU308, SNU478 and SNU1079 cell lines were treated with increasing doses of PF00299804 (0.01, 0.1, 1 μmol/L) for 24h, after which the extracts were immunoblotted with TS antibodies.
Supplementary Table 1. Combination of PF00299804 with 5-FU in biliary tract cancer cell lines NOTE: Shown are the IC50 values of PF00299804 or 5-FU using MTT assay. Combination index for the combination of PF00299804 with 5-FU at the 50% fraction affected was calculated by the Chou and Talalay method in biliary tract cancer cell lines (CI > 1: antagonistic effect, CI = 1: additive effect, CI <1: synergistic effect).
Supplementary Table 2. Combination of PF00299804 with cisplatinin biliary tract cancer cell lines NOTE: Shown are the IC50 values of PF00299804 or cisplatin using MTT assay. Combination index for the combination of PF00299804 with cisplatin at the 50% fraction affected was calculated by the Chou and Talalay method in biliary tract cancer cell lines (CI > 1: antagonistic effect, CI = 1: additive effect, CI <1: synergistic effect).