Using Real-time Data
Using Real-time Data. What is Real-time Data?. Data that is being collected by scientists, students, teachers, or trained citizens from an actual site. Some data is up to the minute such as buoy data. Data can be used to analyze and answer questions about rivers, estuaries, and oceans.


Using Real-time Data
E N D
Presentation Transcript
What is Real-time Data? • Data that is being collected by scientists, students, teachers, or trained citizens from an actual site. • Some data is up to the minute such as buoy data. • Data can be used to analyze and answer questions about rivers, estuaries, and oceans.
Using Real-time Data The purpose is to observe the abiotic factors that affect ecosystems and determine water quality of aquatic and coastal ecosystems.
Where can I find Real-time data? • Ocean Observing Systems http://marine.rutgers.edu/outreach/rtd/resources4.htm • National Estuarine Research Reserve System http://cdmo.baruch.sc.edu/
Where can I find Real-time data? • Eyes on the Bay (Chesapeake Bay) http://mddnr.chesapeakebay.net/eyesonthebay/index.cfm • Ocean U.S. http://www.ocean.us/
National Data Buoy Center http://www.ndbc.noaa.gov/maps/Northeast.shtml
http://carocoops.org/carocoops_website/buoy_graph.php?interval=1_yearhttp://carocoops.org/carocoops_website/buoy_graph.php?interval=1_year • Carolina’s coastal ocean and observing and predicting system
Research Question • Does bottom salinity vary or does it stay relatively stable? • View a number of graphs; not just one or two. • Look at one location first.
Bottom Salinity Year???http://carocoops.org/carocoops_website/buoy_graph.php?interval=1_day
Could you answer the original question? • Is it too vague? Yes. • Could you give a range of salinities? • Could you look at surface salinities to see if that changes more. You could but that is another question altogether. Keep focused.
Research question: • Does the dissolved oxygen in the Potomac River ever reach levels detrimental to aquatic life? • First, find out what levels are acceptable and at what numbers fish will die. Then check out some of the data for the Potomac River.
Potomac River - St. Georges Creek http://mddnr.chesapeakebay.net/newmontech/contmon/eotb_results_graphs.cfm?station=stgeorges
The previous slide does not give enough information to draw any conclusions. Think about how much data is necessary to answer questions. • These slides are designed to get you thinking and started but are not part of a complete project. • Follow the Rubric and instructions given in class.
Nickname:Green Harbor River 1 Serial Number (SN):2008485 Model:HOBO U30 Station - GSM Firmware Version:1.008
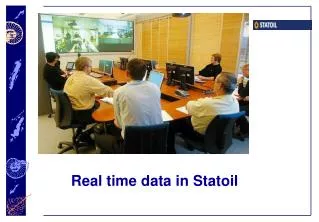
Green Harbor River, Marshfield Tide Station Installed – With support from the MA Corporate Wetlands Restoration Partnership, the ERM Foundation, the UMASS-Boston Coastal Environmental Sensing Network, MA Audubon, and the Town of Marshfield, CZM-WRP has installed a semi-permanent tide monitoring station along the Green Harbor River in Marshfield. The solar-powered, high-tech station continuously reads tide height, water temperature, and salinity. Every 30 minutes, a telemetric control box dials a cell phone number and data is uploaded to the system, where it can be viewed on the world-wide web in near real-time. The tide station will allow town officials, local landowners, and other project partners to keep a close eye on the Green Harbor River tidal patterns, which are expected to change gradually after the town installs a new, adjustable tide gate within the Green Harbor Dike along Route 139.
Green Harbor River 1 Monitoring Station at Audubon Bridge: Tide and Temperature https://www.hobolink.co m/p/19999b4567265d745c0e8038b0528d89
Water Level MSL ref (Water level MSL ref): -1.832 Feet Temperature (Water Temp): 12.82 °CGreen Harbor River October 14, 2008
http://www.gomoos.org/ • Real-Time Data • Buoys and Stations Collecting Weather and Ocean Data • Latest Conditions:Highest winds: 33 mph | Nantucket (44008) | 7:00 AMBiggest waves: 10.8 ft | Nantucket (44008) | 7:00 AM • Hourly information developed for marine operations. Includes wind, wave, visibility, air temperature, water temperature at various depths and more. Real-time, forecast and historical data is available from GoMOOS, NOAA and other regional monitoring efforts.
Historical data Buoy conditions • Welcome to the GoMOOS Environmental Data Reporting System! Weather and sea condition data are collected from our buoys in the Gulf of Maine. • These pages are designed to help you access the collected data in order to enhance your work, study or play! • View the following types of data: • air temperatures • water temperatures • wind direction & speed • wave heights • salinity • ... and many more! • Output your data to: • text files (CSV)(best for import into MS Excel spreadsheets) • html tables • graphs
When was the data logger in the river? What else can you determine from the graph?
What was the water temperature in Green Harbor on September 30, 2010?
What was the water temperature at Brant Rock? These loggers were worn around the neck until deployed.
Gliders http://www.ndbc.noaa.gov/gliders.php