Using Satellite Data to Improve Operational Air Quality Forecasting Capabilities
490 likes | 681 Vues
Using Satellite Data to Improve Operational Air Quality Forecasting Capabilities. Shobha Kondragunta NOAA/NESDIS Center for Satellite Applications and Research.

Using Satellite Data to Improve Operational Air Quality Forecasting Capabilities
E N D
Presentation Transcript
Using Satellite Data to Improve Operational Air Quality Forecasting Capabilities Shobha Kondragunta NOAA/NESDIS Center for Satellite Applications and Research Contributions from: ArlindoDa Silva (NASA), Jinping Huang (SAIC@EMC), Ed Hyer (NRL), Hyuncheol Kim (UMD-CICS@ARL), Sarah Lu (SAIC@EMC), Jeff McQueen (EMC), Brad Pierce (NESDIS), IvankaStajner (NWS/OST), JianZeng (ERT@STAR), Xiaoyang Zhang (UMD-CICS@STAR), Qiang Zhao (IMSG@STAR) JCSDA Seminar Series May 22, 2013 College Park, MD
National Air Quality Forecast Capability • Improving the basis for air quality alerts • Providing air quality information for people at risk • NWS Prediction Capabilities: • Operations: • Ozone nationwide: expanded from EUS to CONUS (9/07), AK (9/10) and HI (9/10) • Smoke nationwide: implemented over CONUS (3/07), AK (9/09), and HI (2/10) • Dust over CONUS: (3/12) • Developmental testing: • Components for particulate matter (PM) forecasts Adversity of Effects Proportion of Population Affected
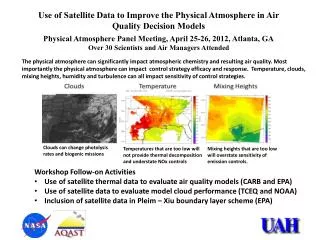
JCSDA Atmospheric Composition Working Group Focus • Global and regional aerosol model improvements • Correct sources (e.g., fire emissions) • Improve initial conditions via data assimilation • Use of satellite data in diagnosing issues with model physics and chemistry • Near real time verification
Talk Outline • Part 1: GOES/MODIS Aerosol Optical Thickness (AOD) assimilation in CMAQ • Funded by GOES-R program • Part 2: Development of global biomass burning emissions product for NGAC – a joint activity between NASA, NESDIS, and NCEP • Funded by JCSDA and PSDI • Part 3: Aerosol product development for NWS HYSPLIT operational air quality forecast verification • Funded by NWS and GOES-R • Part 4: Global aerosol model assimilation
Part 1 GOES/MODIS Aerosol Optical Thickness (AOD) assimilation in CMAQ
Background • NWS uses NOAA-EPA developed CMAQ model to provide air quality forecast guidance. • Ozone forecast is operational • PM2.5 forecast is under development • Previous studies showed that CMAQ model generally under-predicts PM2.5 concentrations in summer. • Association between satellite derived Aerosol Optical Depth (AOD) and ground level PM2.5 concentration has a potential to improve PM2.5 prediction with AOD assimilation. • Objective of this study is to test if satellite-derived AOD product assimilation will help improve surface PM2.5 predictions.
Copy of a Developmental Version of Air Quality Prediction System EPA NEI NCEP NMM • A copy of NCEP developmental PM version air quality forecast system • CONUS (5x) domain: 442x265 with 12 km resolution and 22 hybrid sigma layers • Aerosol variables: 26 • Community Radiative Transfer Model (CRTM) used to compute AOD PREMAQ BCON ICON CMAQ CONC Output CONC Adjustment AOD Retrievals AOD Analysis … + AOD Calculation
GOES AOD • Retrieved from the GOES visible imagery • 4 km X 4 km horizontal resolution • Every 30 minutes during the sunlit portion of the day • Total column AOD w/o aerosol type or size distribution information
Ri R0 Grid Point Grid point to evaluate Observation Radius of influence Distance of observation Objective Analysis of Satellite-derived AOD • Cressman style successive correction scheme • Two passes with reducing radius of influence • 1st pass: R0 = 4 grid-length (48 km) • 2nd pass: R0 = 2 grid-length (24 km)
An AOD Analysis Example Number, surface area and mass concentrations of all aerosol species in all layers are adjusted the same way, so that the size, type and vertical distributions from the first guess are all kept the same
data assimilation window consisting of several analysis-forecast mini-cycles Analysis-Forecast Cycling Scheme forecast to 48 hours forecast to 48 hours DA forecast to 48 hours AOD retrievals DA forecast to 48 hours AOD retrievals DA forecast to 48 hours AOD retrievals
Case I: Urban/Industrial Haze DA-GOES BASE • July 30-August 6, 2006 • Eastern U.S. • Hot and humid weather • Ozone and PM violations DA-GOES DA-MODIS BASE BASE Byun et al., Efficacy of incremental reduction of input uncertainties to improve air quality predictions, Air pollution modeling and its application, 2007
Model predicted AOD agrees with in situ observations better for assimilation run than base run PBL dynamics appear to modulate surface PM2.5 concentrations Model Dynamics
Towards Operational Implementation • Target NEMS/NMM‐B inline AQ model • Developed at NCEP under ESMF framework • Based on CMAQ/CB05/AERO5 • Generate proxy IC datasets with current MET and CMAQ model outputs for DA development • Phased approach to build up the AQ DA capability • Use column AOD as analysis variable. Model variables will be adjusted according to the AOD increment • Accomplishments: • GOES AOD converters (encoder and decoder) to/from BUFR format • CMAQ IOAPI to/from NEMSIO converters • CRTM-CMAQ module for AQ concentrations to AOD calculation • Background error statistics
Part 1: Summary • An Analysis-Forecast Cycling scheme based on Cressman style objective analysis method was developed to assimilate GOES AOD and MODIS AOD products in CMAQ model. • AOD assimilation studies show a significant impact on CMAQ PM2.5 predictions • For industrial/urban episode, assimilation of hourly GOES AODs significantly improves the surface PM2.5. • PBL dynamics appear to modulate surface PM2.5 concentrations • For wild fire episode, improvements to surface PM2.5 predictions were marginal. A lack of fire emissions and dependence on model vertical profile led to over prediction of PM2.5 near the surface in the assimilation run. • Path forward • NCEP terminated all aerosol assimilation activities in 2012. • STAR migrating the assimilation system to its computers to do stand-alone experiments. • NWS considering re-initiating aerosol assimilation activities.
Part 2 Development of global biomass burning emissions product for NGAC – a joint activity between NASA, NESDIS, and NCEP
Overview of NOAA GFS Aerosol Component (NGAC) • Model Configuration: • Forecast model: Global Forecast System (GFS) based on NOAA Environmental Modeling System (NEMS), NEMS-GFS • Aerosol model: NASA Goddard Chemistry Aerosol Radiation and Transport Model, GOCART • Phased Implementation: • Dust-only guidance is established in Q4FY12 • Dust, sea-salt, OC/BC, and sulfate aerosol forecast once real-time global smoke emissions are developed and tested (NWS/NCEP-NESDIS/STAR-NASA/GSFC collaboration) • Near-Real-Time Dust Forecasts • 5-day dust forecast once per day (at 00Z), output every 3 hour, at T126 L64 resolution • ICs: Aerosols from previous day forecast and meteorology from operational GDAS Acknowledge: Development and operational implementation of NGAC represents a successful “research to operations” project sponsored by NASA Applied Science Program and JCSDA
Global biomass burning emissions • Joint NASA/GMAO, NESDIS/STAR, and NWS/NCEP project to: • Develop near real time biomass burning emissions product covering the whole globe from polar and geostationary satellites for NEMS-GFS-GOCART • Globally, biomass burning is one of the primary sources of aerosols; burning varies seasonally, geographically and is either natural (e.g., forest fires induced by lightning) or human induced (e.g., agricultural burning for land clearing). Satellites can provide this information on a real time basis. • Develop and deploy a global aerosol prediction system that can in the future assimilate satellite-derived atmospheric composition parameters • Meet Research (NASA) to Operations (NOAA) goals of the JCSDA • QFED code transition from NASA to NOAA
Annual Global Biomass Burning Aerosol Emissions from Satellite-derived Fire Radiative Power (FRP) No coverage over high latitudes from geostationary satellites GOES-E and GOES-W Meteosat MTS-2 INSAT-3D can help fill this data gap Key: PM2.5: Particulate mass for particles smaller than 2.5 um in size DOY: Day of the Year Kg: Kilograms Zhang, X. Y, S. Kondragunta, J. Ram, C. Schmidt, H-C. Huang, Near-real time global biomass burning emissions product from geostationary satellite constellation, JGR, 2012
Flowchart for blended Polar and Geo biomass burning emissions QFEDv2 GBBEP-Geo QFED: Quick Fire Emission Dataset from MODIS fire data GBBEP-Geo: Global Biomass Burning Emissions Product from Multiple Geostationary Satellites Geostationary satellite fire detections Terra+Aqua MODIS fire detections MODIS fire FRP with cloud adjustment Simulating diurnal FRP Simulate AOD using NEMS-GFS-GOCART MODIS fire emissions GOES Fire emissions Scaling MODIS fire emissions Calibrate Fire emissions Scaling GOES fire emissions MODIS AOD Blended Emissions
MODIS AOD
Scaling Satellite-derived Emissions Europe and Africa
Flowchart for blended Polar and Geo biomass burning emissions QFEDv2 GBBEP-Geo QFED: Quick Fire Emission Dataset from MODIS fire data GBBEP-Geo: Global Biomass Burning Emissions Product from Multiple Geostationary Satellites Geostationary satellite fire detections Terra+Aqua MODIS fire detections MODIS fire FRP with cloud adjustment Simulating diurnal FRP Simulate AOD using NEMS-GFS-GOCART MODIS fire emissions GOES Fire emissions Scaling MODIS fire emissions Calibrate Fire emissions Scaling GOES fire emissions MODIS AOD Blended Emissions
Flowchart for blended Polar and Geo biomass burning emissions • Scaling factors are region and biome dependent but static. • Blended emissions will be generated daily at NESDIS/OSPO for NGAC. • Scaling factors need to be re-generated only if there is a new satellite replacing an old satellite. Scaling MODIS fire emissions Calibrate Fire emissions Scaling GOES fire emissions Blended Emissions
Part 2: Summary • Scaling factors for biomass burning emissions obtained in this study similar to other studies. For example NRL scales biomass burning emissions in its Navy Aerosol Analysis and Prediction System (NAAPS) by a factor of 3; • NESDIS and NASA has to consider the extension of QFED dataset from using MODIS to NPP VIIRS; • NGAC operational implementation of global biomass burning emissions to occur in 2015 but development and parallel test forecast system to occur in 2013-2014 time period.
Part 3 Aerosol product development for NWS HYSPLIT operational air quality forecast verification
GOES Smoke Concentration Product (1) • Column average smoke concentration (µg/m3) using AOD and fire hot spots from GOES • Uses source apportionment and pattern recognition techniques to isolate smoke aerosols from other type of aerosols • Smoke mass concentration (mc) is obtained using AOD (τ), mass extinction efficiency (k), and aerosol height (h) • Product specifications • Name:ASDTA • Satellites:GOES-East and GOES-West (includes Alaska and Hawaii) • Accuracy: 40% • Spatial resolution:0.15o • Temporal resolution: hourly • Latency: one day • Data format:binary file, GRIB file, JPEG imagery • Data availability:2007 - present Animation of Smoke Plume Detection Original AOD Image Smoke AOD Image http://www.ssd.noaa.gov/PS/FIRE/ASDTA/asdta.html Zeng, J., S. Kondragunta, and I. Stajner, An automated smoke detection and tracking algorithm, to be submitted to GRL, 2013
GOES Smoke Concentration Product (2) July 13, 2009 17Z – 18Z NWS testing of smoke verification for Alaska using NESDIS GOES-W smoke product Forecast Observation http://airquality.weather.gov/
Aqua MODIS Dust Mask Product (1) • Column average dust concentration (µg/m3) • Uses Aqua MODIS deep blue AOD and an independently derived dust flag • Dust mass concentration (mc) is obtained using AOD (τ), mass extinction efficiency (k), and aerosol height (h) • Product specifications • Name:MODIS Dust Mask • Satellites:Aqua • Accuracy: 70% • Spatial resolution:0.1o • Temporal resolution: daily • Latency: one day • Data format:netCDF4 and GRIB1 • Data availability:2013 - present
Aqua MODIS Dust Mask Product (2) • Threshold concentration > 1 µg/m3, for average dust in the column • Tracking threat scores, or figure-of-merit statistics: • (Area Pred ∩ Area Obs) / (Area Pred U Area Obs) • Initial skill target 0.05 34
Part 3: Summary VIIRS ASDA • Routine use of NESDIS smoke and dust product by NWS to verify operational forecasts: • ASDA work started in 2005. GOES-E product became operational in 2008 and GOES-W in 2009. • Aqua MODIS dust mask work started in 2008. Product became operational in 2012. • NESDIS continuing to refine the dust mask algorithm and applying it to SNPP VIIRS VIIRS Dust Mask
Part 4 Global Aerosol Model Assimilation
Navy Global Aerosol Forecasting • Operational at FNMOC from September 2009 (over ocean) • Land and ocean MODIS assimilated in operations since February 2012 • Assimilation system is “2D-VAR” for total column AOD based on NAVDAS 3DVAR system • Large development effort required for producing DA-quality products from off-the-shelf MODIS data • Operational AOD assimilation reduces RMS error in analyzed AOD by >50% • Publications about aerosol DA • Zhang, J. L., et al.: Evaluating the impact of assimilating caliop-derived aerosol extinction profiles on a global mass transport model, Geophys. Res. Lett., 38, L14801, doi:/10.1029/2011gl047737, 2011. • Zhang, J. L., et al.: A system for operational aerosol optical depth data assimilation over global oceans, J. Geophys. Res.-Atmos., 113, D10208, D10208, doi:/10.1029/2007jd009065, 2008.
The NRL-UND MODIS Level 3 Aerosol Optical Depth Product • Produced in NRT by NASA LANCE, <4 hour latency • Available now: ESDT name is ‘MxDAODHD’ • Publications about AOD data quality • Shi, Y., et al.: Critical evaluation of the modis deep blue aerosol optical depth product for data assimilation over north africa, Atmospheric Measurement Techniques, 6, 949-969, doi:10.5194/amt-6-949-2013, 2013. • Campbell, J. R., et al.: Evaluating nighttime caliop 0.532 mu m aerosol optical depth and extinction coefficient retrievals, Atmospheric Measurement Techniques, 5, 2143-2160, 10.5194/amt-5-2143-2012, 2012. • Hyer, E. J., et al.: An over-land aerosol optical depth data set for data assimilation by filtering, correction, and aggregation of modis collection 5 optical depth retrievals, in: Atmospheric Measurement Techniques, European Geophysical Union, 379-408, 2011. • Shi, Y., et al.: An analysis of the collection 5 modis over-ocean aerosol optical depth product for its implication in aerosol assimilation, Atmos. Chem. Phys., 11, 557-565, 10.5194/acp-11-557-2011, 2011. • Zhang, J. L., Reid, J. S., and Holben, B. N.: An analysis of potential cloud artifacts in modis over ocean aerosol optical thickness products, Geophys. Res. Lett., 32, L15803, doi:10.1029/2005GL023254, 2005. • Zhang, J. L., and Reid, J. S.: Modis aerosol product analysis for data assimilation: Assessment of over-ocean level 2 aerosol optical thickness retrievals, J. Geophys. Res.-Atmos., 111, D22207, doi:10.1029/2005JD006898, 2006. • Thanks to NASA Air Quality Applied Science Team for supporting transition of this product to LANCE 14 April 2011 38 of 25
GEOS-5 Aerosol Data Assimilation • Simultaneous estimates of background bias (Dee and da Silva 1998) • Adaptive Statistical Quality Control (Dee et al. 1999): • State dependent (adapts to the error of the day) • Background and Buddy checks based on log-transformed AOD innovation • Error covariance models (Dee and da Silva 1999): • Innovation based • Maximum likelihood Focus on NASA EOS instruments, MODIS for now Global, high resolution 2D AOD analysis 3D increments by means of Local Displacement Ensembles (LDE)
Online global chemical and aerosol assimilation/ forecasting system • UW-Madison hybrid coordinate model (UW-Hybrid) dynamical core • Unified stratosphere/troposphere chemical prediction scheme (LaRC-Combo) developed at NASA LaRC • Aerosol prediction scheme (GOCART) developed by Mian Chin (NASA GSFC). • Statistical Digital Filter (OI) assimilation system developed by James Stobie (NASA/GFSC) RAQMS has been used to support airborne field missions [Pierce et al, 2003, 2007, 2008], develop capabilities for assimilating satellite trace gas and aerosol retrievals [Pierce et al., 2007, 2008, Fishman et al., 2008, Sunita et al., 2008] and assess the impact of global chemical analyses on regional air quality predictions [Song et al., 2008, Tang et al., 2008]
Case Study: Severe weather April 27th, 2011 (Huntsville tornado) WRF-CHEM simulations conducted by Pablo Saide in collaboration with Greg Carmichael and Scott Spak (U-Iowa) Inclusion of aerosol cloud interactions significantly impacts the predicted precipitation distribution and improves forecast over Huntsville, AL SPC 12hr precip and tornado tracks valid 06Z on April 28, 2011 WRF-Chem + RAQMS BC WRF no aerosols
Part 4: Summary • NRL and NASA assimilating MODIS aerosol products in their forecast models and are preparing to assimilate VIIRS aerosol products. • Given that these centers are moving forward with global aerosol assimilation due to the importance of impact on weather and regional air quality/visibility predictions, it is important for NWS to consider aerosol assimilation • With support from NASA and JCSDA, development work at NCEP has already taken place. Further development is needed.
Categorical Evaluation POD B FAR HSS
Categorical Evaluation B POD FAR HSS
Case II: Wild Fire • Sept. 01-09, 2006 • US NW Region DA-GOES DA-MODIS DA-FINE BASE BASE BASE
Vertical Profiles of Aerosol Loading CALIPSO BASE DA-GOES