Using Satellite Data to Improve Operational Atmospheric Constituents Forecasting Capabilities
170 likes | 336 Vues
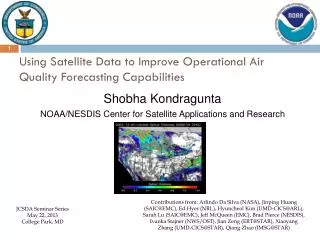
Using Satellite Data to Improve Operational Atmospheric Constituents Forecasting Capabilities Shobha Kondragunta , NOAA/NESDIS/STAR Xiaoyang Zhang, UMD - CICS @ NOAA/NESDIS/STAR Arlindo da Silva, NASA Goddard Space Flight Center Sarah Lu, IMSG @ NOAA/NWS/NCEP Hyun Cheol Kim, NOAA/ARL.

Using Satellite Data to Improve Operational Atmospheric Constituents Forecasting Capabilities
E N D
Presentation Transcript
Using Satellite Data to Improve Operational Atmospheric Constituents Forecasting Capabilities ShobhaKondragunta,NOAA/NESDIS/STAR Xiaoyang Zhang, UMD - CICS @ NOAA/NESDIS/STAR Arlindoda Silva, NASA Goddard Space Flight Center Sarah Lu, IMSG @ NOAA/NWS/NCEP Hyun Cheol Kim, NOAA/ARL
Project Overview • Joint NASA/GMAO, NESDIS/STAR, and NWS/NCEP project to: • Develop near real time biomass burning emissions product covering the whole globe from polar and geostationary satellites for NEMS-GFS-GOCART • Globally, biomass burning is one of the primary sources of aerosols; burning varies seasonally, geographically and is either natural (e.g., forest fires induced by lightning) or human induced (e.g., agricultural burning for land clearing). Satellites can provide this information on a real time basis. • Develop and deploy a global aerosol prediction system that can in the future assimilate satellite-derived atmospheric composition parameters • Meet Research (NASA) to Operations (NOAA) goals of the JCSDA • QFED code transition from NASA to NOAA
Blended Polar and Geo BBEP Flowchart QFEDv2 GBBEP-Geo QFED: Quick Fire Emission Dataset from MODIS fire data GBBEP-Geo: Global Biomass Burning Emissions Product from Multiple Geostationary Satellites Geostationary satellite fire detections Terra+Aqua MODIS fire detections MODIS fire FRP with cloud adjustment Simulating diurnal FRP Simulating AOD using NEMS-GFS-GOCART MODIS fire emissions Fire emissions Scaling MODIS fire emissions Calibrating Fire emissions Scaling fire emissions MODIS AOD Blended global biomass burning emission
Biomass Burning Emission Derived from Fire Radiative Power FRP = AσT4 • Fire Radiative Power (FRP) • FRP can also be empirically derived from 3.9 um radiance • Fire Radiative Energy • Biomass combusted • Emissions • σ -- 5.67x10⁻⁸ Js-1K-4 • A – area bruned • T – fire temperature • -- 0.368±0.015 kg/MJ • Lh – radiance at 3.9 um • Lbk – background radiance • EF – emissions factors • a -- constant BC = FRE*β E = BC*EF
Calibration of Multiple Satellite-based Fire Emissions • Scaling factors determined by comparing model simulated AOD with observed MODIS AOD CEterra=a1Eterra CEaqua=a2Eaqua CEgoes_E=a3Egoes_E CEgoes_w=a4Egoes_W CEmetosat=a5Emetosat CEmtsat=a6Emtsat CE represents scaled emissions and E is satellite-dependent fire emissions. Parameters a1-a6 are scaling factors calculated by comparing year-long model-simulated AOD and MODIS AOD
NASA Quick Fire Emission Dataset (QFED) • QFEDv2—Calculated from MODIS FRP for various biome types and tuned using scaling factors which are obtained by comparing GFS-GOCART-modeled AOD with MODIS observed AOD. • Emissions are tuned respectively for Terra MODIS and Aqua MODIS, which are then combined to produce daily global emissions. • Final QFED product at 0.25x0.3125 degree is merged from Terra and Aqua daily fire emissions of BC, OC, SO2, CO, CO2, PM2.5
GBBEP-Geo: Simulating Diurnal FRP from Geostationary Satellites Diurnal FRP patterns are simulated by combining the available instantaneous FRP observations within a day and a set of representative climatological diurnal patterns of FRP for various ecosystems GOES-E and GOES-W METEOSAT MTSAT Averaged from DOY 257-305, 2009 Climatological diurnal patterns of GOES FRP
GBBEP-Geo: Global Biomass Burning Emissions Product from Multiple Geostationary Satellites • Hourly fire emissions for CO, OC, BC, CO2, SO2, PM2.5 • Limited coverage in high latitudes and no coverage in most regions across India and parts of boreal Asia No spatial coverage
MODIS AOD for Comparison with Modeled AOD Spatial patterns of MODIS AOD and Hazard Mapping System (HMS) fire hot spots.
Calibration of Simulated FRP between GOES-E and GOES-W • Estimating satellite-scaling factor between GOES-E and GOES-W
Calibration of GBBEP-geo with Scaled QFEDv2 GBBEP-geo can be calibrated to be equivalent to QFEDv2 to generate global blended fire emissions because the QFEDv2 has been scaled using MODIS AOD.
NEMS GFS Aerosol Component (NGAC) NCEP’s global interactive atmosphere-aerosol forecast system • Model Configuration: • Forecast model: Global Forecast System (GFS) based on NOAA Environmental Modeling System (NEMS), NEMS-GFS • Aerosol model: NASA Goddard Chemistry Aerosol Radiation and Transport Model, GOCART • Phased Implementation: • Dust-only guidance is established in Q4FY12 • Full-package aerosol forecast after real-time global smoke emissions are available and tested (JSDI project) • NRT Dust Forecasts • 5-day dust forecast once per day (at 00Z), output every 3 hour, at T126 L64 resolution • ICs: Aerosols from previous day forecast and meteorology from operational GDAS • GRIB2 products in 1x1 degree: 3-d distribution of dust aerosols (5 bins from 0.1 – 10 µm) and 2-d aerosol diagnosis fields (e.g., aerosol optical depth, surface mass concentration) • Operational since Sept 2012 Acknowledge: Development and operational implementation of NGAC represents a successful “research to operations” project sponsored by NASA Applied Science Program, JCSDA and NWS
NGAC experiments using smoke emissions from GFEDv2, QFEDv2, and GBBEP-Geo for 2011 Seasonal variations: Surface mass concentration for dust aerosols (top) and carbonaceous aerosols using QFED2 (bottom) for different season (July on the left and March on the right). The model is still running for GBBEP-Geo results.
NGAC experiments using smoke emissions from GFEDv2, QFEDv2, and GBBEP for 2011 Biomass Burning: QFED V2 versus GFED (global map on the left and regional map over Africa on the right) and time series of OC/BC surface concentration over Africa (black for QFED2 and green for GFED)
Summary and Ongoing Work • NGAC model run with QFED2 emissions for 2011 completed • Model output will be compared to MODIS AOD to determine scaling factors • NGAC model run with GBBEP-Geo emissions for 2011 is currently ongoing • QFED code successfully implemented on STAR computers. • Other approaches to determine scaling factors (inter-satellite calibration) will be used to minimize the model simulations needed. • Product validation is critical. Direct validation is currently not possible because of the lack of reliable in-situ measurements. We will work on inter-comparison with other biomass burning emission products. • Algorithm Critical Design Review (CDR) to be held in May 2013