Using atmospheric CO2 data
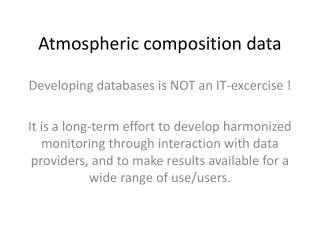
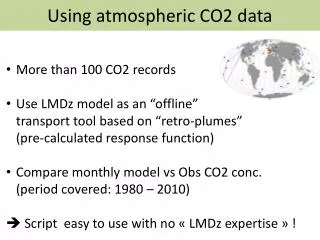
More than 100 CO2 records Use LMDz model as an “offline” transport tool based on “retro-plumes” (pre-calculated response function) Compare monthly model vs Obs CO2 conc. (period covered: 1980 – 2010) Script easy to use with no « LMDz expertise » !. Using atmospheric CO2 data.

Using atmospheric CO2 data
E N D
Presentation Transcript
More than 100 CO2 records • Use LMDz model as an “offline”transport tool based on “retro-plumes”(pre-calculated response function) • Compare monthly model vsObs CO2 conc.(period covered: 1980 – 2010) • Script easy to use with no « LMDz expertise » ! Using atmospheric CO2 data
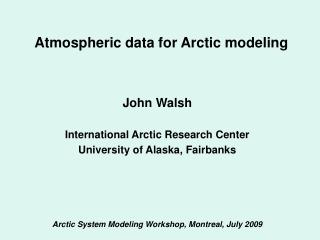
Work for CO2 or non reactive species • Need to prepare YOUR surface CO2 fluxes • Fluxes: 3D array (lon, lat, time) • Time variable : from monthly to daily fluxes • Run the script (few hours for several sites) • OUTPUTS: • Netcdf file: time series of atmconc. • Graphs: Your model ConcagainstObserved CO2(possiblyaddingFossil fuel & ocean fluxes) Using atmospheric CO2 data
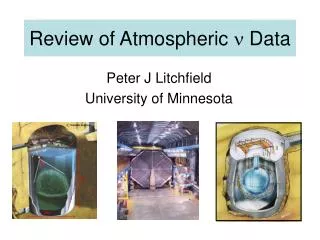
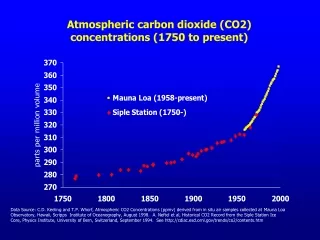
S3: CO2 concentrations (obs. In grey) Monthly CO2 (ppm) Year