Download

1 / 19
190 likes | 286 Vues
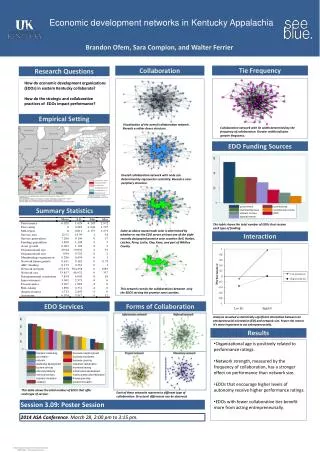
This study delves into the perceptions of healthcare providers regarding diabetes education in the Appalachian region of the United States. It highlights the prevalence of diabetes, patient barriers, and resource challenges faced in delivering diabetes education. The research analyzes factors such as provider needs, patient obstacles, and strategies for improving diabetes education programs in distressed and at-risk counties.

E N D
Diabetes Education in Appalachia: Providers’ Views S.A. Denham, K.E. Remsberg, & L. Wood Ohio University, Athens, Ohio Diabetes: A Family Matter Conference March 18, 2009
Acknowledgements • Graduate assistants who contributed to this project by distributing surveys and compiling data were: • Cara Butcher • Tammy Collier • Eimi Lev • Patricia Harris • Stacey Hartman • Tara O’Brien • Funding sources: • CDC’s National Diabetes Education Program, • Ohio Department of Health Diabetes Prevention and Control Program • Ohio University, Diabetes Research Initiative & Appalachian Rural Health Institute, College of Health & Human Services, School of Nursing
Epidemiology of Type 2 Diabetes • Prevalence of diabetes, U.S. 2008 all ages* • Total: about 24 million people (7.8% of the population) • Diagnosed: 17.9 million people • Undiagnosed: 5.7 million people • 1.5 million new cases diagnosed in 2005 • Mortality • 7th Leading cause of death • Under-reported (only 35-40% with diabetes had it listed on death certificates) • Twice as high as for others without diabetes • (2007) Direct costs $116 Billion Indirect Costs $58 Billion
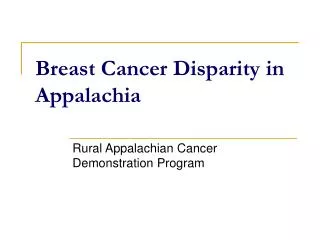
Prevalence of Diagnosed Diabetes United States, 2006 BRFSS [2006], CDC/Div. of Diabetes Translation 6.6 to 10.1% said yes to “Did a doctor tell you that you have diabetes?”
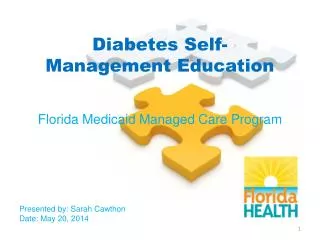
Prevalence of Diagnosed Diabetes: Cincinnati, Ohio - 1999, 2002, 2005 2005 Greater Cincinnati Community Health Status Survey: White Appalachian Chart Book
Prevalence of Diagnosed Diabetes: Cincinnati, Ohio - 2005 2005 Greater Cincinnati Community Health Status Survey: White Appalachian Chart Book
Prevalence of Diagnosed Diabetes: Appalachian Ohio – 2006* 2006 ARHI
The Reach of Diabetes Education • US Prevalence • About half of those with diabetes have taken a class on diabetes self-management, (52%) • Those older than 65 years of age are less likely (46%) • Diabetes Education and Insurance (under 65 years) • Uninsured (42%) • Medicare (46%) • Medicaid/Indian Health Service (49%) • Private Insurance (54%) • Veterans Administration (79%) • Other traits and Diabetes Education • More likely • Female • African American • Insulin Use • Less likely • Appalachian (Virginia Dept. Health, 2004)
Study Purpose Evaluate provider perceptions about the provision of diabetes education throughout the Appalachian region of the United States.
Distressed/At-Risk Locations • Distressed County • Poverty 1.5x national average • Unemployment > 1.5x national average • Per capita market income no more than 2/3 national average • OR, poverty 2x national average, plus unemployment or PCMI • At-Risk County • Poverty ≥ 1.25x national average • Unemployment ≥ 1.25x national average • Per capita market income no more than 2/3 national average • OR meeting 2 of 3 distressed criteria
Survey Subjects • Federally Qualified Health Centers • N = 135 (54 clinics/hospitals and 81 HD) • Health Departments • N = 82 • Diabetes Educators • N = 47 (46 situated in hospitals/clinics and 1 in a HD)
Questionnaire Topics • A 40-item questionnaire • Information collected from the survey: • Amount, type of diabetes education available • Providers of education • Patient barriers to receiving education • Provider obstacles to delivering education
Statistical Analysis • Descriptive analyses of factors assessed by provider perceptions of Diabetes Education. • Cross-sectional comparison of percentages according to Distressed-At-Risk County status • P-values ≤ 0.05 were statistically significant
Table 1: Study Area Characteristics by Distressed-At Risk Status
Table 2: Diabetes Education Programs in Appalachia, by Distressed-At Risk Status
Table 3: Patient Barriers for Scheduled Diabetes Education Sessions, by Distressed-At Risk Status
Table 4: Perceived Resource Problems withDiabetes Education Programs, by Distressed-at Risk Status
Discussion • Provision of Diabetes Education - Appalachia: • DAR may not be worse than NDAR • Provider needs: Lack of resources, medical specialists, staff and CDEs to provide diabetes education • Patient barriers: Lack of transportation, insurance, literacy • Perception/reality of increasing diabetes, costs • Lead to further discrepancy between diabetes and education/care needed.
Recommendations • Fewer CDEs available in DAR, educators more likely to be busy RNs • CDEs more likely to be employed in hospitals than clinics and health departments • Fewer people in the Appalachian region appear to be getting diabetes education than nationally • Broad inclusion of family in diabetes education • Barriers (e.g., costs, distance, etc.) need to be addressed locally • Low literacy and health literacy