Download
1 / 23
591 likes | 1.94k Vues
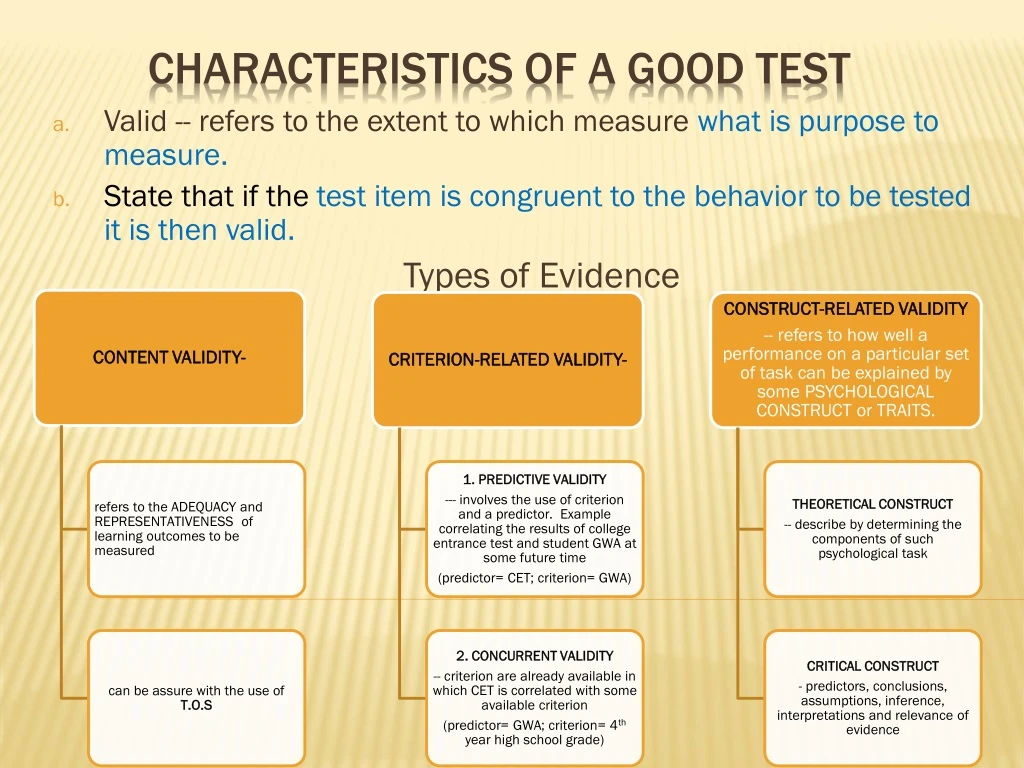
Valid -- refers to the extent to which measure what is purpose to measure. State that if the test item is congruent to the behavior to be tested it is then valid. Types of Evidence. Characteristics of a good test. RELIABILITY: --refers to the “CONSISTENCY” of the test score.

E N D
Valid -- refers to the extent to which measure what is purpose to measure. State that if the test item is congruent to the behavior to be tested it is then valid. Types of Evidence Characteristics of a good test
RELIABILITY: --refers to the “CONSISTENCY” of the test score. --ERRORS of measurements are factors or conditions that can contribute to the lowering of the test reliability. If the test has low reliability we can be assure that errors of measurement have affected the test scores to the point that the test is UNRELIABLE Characteristics of a good test SOME ERRORS OF MEASUREMENTS
DEGREES OF RLATIONSHIP BETWEEN TWO SETS OF SCORE • +1.00----PERFECT POSITVE RELATIONSHIP (the better)more from the upper group got the test correctly. • 0.00---- NO RELATIONSHIP • -1.00----PERFECR NEGATIVE RELATIONSHIP more from the lower group got the test correctly. Each subtest is correlated with the whole test. The correlation of each subtest which measures a particular components contribute to the measurement of a psychological trait which is critical thinking. Define by: X Y (proportion (subtest) (correlation with the total score) of common variance) • DISCRIMINANT VALIDITY---DIFFERENT TRAITS CONSTRUCT • --- SCORE OF CRITICAL THINKING TEST ARE CORRELATED WITH THOSE OF ATTITUDES TOWARDS MOVIES To determine the construct validity of critical thinking
TEST-RETEST METHOD --determines how scores are consistent over a given period of time. The same test is administered twice to the same group with an interval between 2 to 15 days(sufficient time interval)(2-3 days student can recall answer)(longer time interval lower the reliability)/true score= true score+error of measures/ PARALLEL/ALTERNATE FORMS METHOD --used two different versions of the same test, administered to the same group close together in time. It used form A or B and can be given on the same day or the next day. The difference of the two is how they worded or written, it should measure the same skills and errors are significantly controlled TEST-RETEST WITH ALTERNATE FORMS METHOD --administering the two version of the same test on two different occasions. Time interval may be short(2 weeks)(longer for 6 months). Takes into account all possible sources of errors. It is the most useful indicates variation of a test score over a period of time. INTERNAL CONSISTENCY METHOD -- employ only one test administration of the same test given to the same group on individual. DIFERENT METHODS SPILT-HALF /ODD-EVEN METHOD—scoring odd items, scoring even items KUDER RICHARDSON FORMULA 20—two sets of score (odd and even) are correlated using PRODUCT MOMENT CORRELATION COEFFICIENT FORMULA TO TEST THE RELIABILITY OF THE WHOLE TEST (USE SPEARMAN-BROWN PROPHECY FORMULA ) PEARSON r USED TO COMPUTE INTERMNAL CONSISTENCY OF A CERTAIN TEST USED IN SPLIT-HALF METHOD METHODS OF ESTIMATING TEST RELIABILITY
Kuder-Richardson Formula 20 -- ONE ADMINISTRATION OF TEST, determination of individual test taker passing each item, standard deviation of test total score. Reliability coefficient is high then it is said to be homogenous. Consistency of the test scores determined over different parts of the entire test.. RELIABILITY ESTIMATE WHAT TO MEASURE TEST-RETEST : TEST ADMIN, TEST TAKERS ALTERNATE FORMS ; TEST ADMIN, TEST ITSELF, TEST-RETEST WITH ALTERNATE FORMS : TEST ADMIN, TEST ITSELF, TEST TAKERS INTERNAL CONSISITENCY : TEST ADMIN, TEST ITSELF NOTE: a reliability coefficient of +.86 of a test measure that 86/100 of the obtained score of an individual is true score and 14/100 can be attributed to errors of measurements.
Item Analysis Improving the test items
After scoring the test, arrange from lowest to highest. Segregate the top and bottom 27/100 of the paper. Tally the correct answers to each item by each student in the upper 27/100 group. Repeat step three, considering the lower 27/100. Get the percentage of the upper group that obtained the correct answer use U. repeat step 5, considering lower group. Used L. Get the average percent of U and L. Get the difference between U and L. Method to employ in item analysis-using the upper and lower index method 27/100 L/U = NO. OF PUPILS GOT ITEM CORRECT NL/NU = NO. OF PUPIL IN THE LOWER GROUP OVER UPPER GROUP
The higher the difficulty index the easiest the item is. Table interpreting difficulty index Formula: Df = {(U/NU)+(L/NL)}2
A good test item separate the bright performer from the poor The higher the index of discrimination the higher the discrimination TABLE INTERPRETING INDEX OF DISCRIMINATION Formula: Ds = {((U/NU)-(L/NL)}
-must have ACCEPTABLE INDEX OF DIFFICULTY AND DISCRIMINATION MEASUREMENT AND EVALUATION PRELIM BOYET B. ALUAN BSED –II The most useful tool in gathering information. a. test b. quiz c. exam ……………… ACCEPTABLE INDEX OF DIFFICULTY RANGES FROM 0.41 - 0.60 -ACCETABLE INDEX OF DISCRIMINATION RANGES FROM +0.20 - +1.00 FAIR OR REVISED When would you say “good or retained” your item -UNACCEPTED DIFFICULTY OR DISCRIMINATION INDEX POOR OR DISCARDED -BOTH DIFFICULTY AND DISCRIMINATION INDEX ARE UNACCEPTABLE. THEN THE ITEM NEED TO BE DISCARDED RIGHT AWAY
TABLE OF ACTION TO BE TAKEN SEE EXAMPLE
Discrete Point(Single Attribute Assessment) -- example Language assessment in the form of Multiple choices, matching type, true or false, or short answer Charles Spearman(1904)-Two Factor Theory --general Factor Or G-factor and postulates specific or S-factor. Example of tests with g-factor are Raven Progressive Matrices and Catre’s Culture Fair Intelligence test Integrative or Global Assessment(Multiple Trait Assessment) --measure more than one point or objective at a time, and often pragmatic. Example is writing composition Cloze Test --innovative method for testing wherein words are deleted from a passage. The most common practice is to delete every 5th word. The acceptable range for readability of certain reading materials is between 30-50 percent. C-Test -- second half of every word is deleted., leaving the first and last word intact, and commonly contains 100 words Dictation Test -- primarily a test for listening, and spelling. It is a test use to measure the ability to use capital letters, punctuation marks, spell words correctly and write legibly and neatly. ADMINISTERING DICTATION TEST Read each word once or twice as student listen, ask student to write the word. Read the word again for confirmation. Read each sentence slowly once or write then at normal speed once before students are asked to write. And do not read the word while students are writing Oral Interview- --kind of integrative assessment. It is a collecting information through face-to-face between the interviewee and interviewer. The interviewee is not at liberty to modify or make a follow up question. The question should be prepared before hand and objective should be taking in consideration Traditional assessment
Raw scores- scores obtained Tabulating raw scores steps in constructing a grouped frequency distribution are as follows Determine the range of scores, ranges is equal to the highest score minus the lowest score. Determined the appropriate number of class interval ideal 10-15. be sure that the lowest limit is divisible interval . Class interval is defined by k= 1+3.3logn, where n is the number of sample and n = (N/(1+Ne^2)) Or i=range over k, the number of class size. Determine the lowest limit (LL) of the interval, LS/I width = Q*I = LL. Construct the frequency column (f) by tallying the no. of scores opposite each interval. Raking Another way to organize test scores. It is the process of arranging a group of scores from highest to lowest. The highest scores is designated as first ranked, and so on. Steps in ranking the scores 1. arrange the scores from highest to lowest, particular scores may be written as many times as it may occurs. 2. put a serial number opposite to each. 1,2,3,4,,.. 3. average the rank of each scores appearing more than one. Example 45,45,45appear three times and rank as 7, 8, and 9, then add = 24/3 = then they will be rank 8. Measure of central tendency
Histogram Polygon bar Graphing of data
The MEAN– denoted by Simply the average of the group and most widely accepted measures of central tendency For Grouped data -- - using deviation am- assume mean d – deviation --- summation of frequency times devation. Measures of central tendencyMean, Median, Mode For ungrouped data Where -- mean -- summation of x N – total number of scores in distribution
The MEDIAN is defined by -- the middle most score in the distribution. It divides the distribution in half or 50 % of the scores is found above the median, and the other 50 % lies below the median . For ungrouped data 1. Arrange the scores from highest to lowest or vise versa. 2. If odd numbers, median is the middle most number in the distribution. 3. If even average the middle. For grouped data ll- lowest limit of N/2 N- no. of cses Cf- cummulative frequency f- frequency where the measure lies i- nterval
The MODE is defined by -- The most frequent, extremes, and repeated numbers. It is not affected if one number is changed less then or greater than For ungrouped data 1. The mode for ungrouped data is the number that occur most. For grouped data Mode = 3median –(2mean)
The measures of central tendency in different distribution 1. Normal distribution2. positively skewed distribution3. negatively skewed distribution
. Normal distribution -symmetrical distribution.½ is exactly the same to other.It looks like a bell curve or the normal curveit is define as mean=median=modeit shows that 50% performed well while the other 50% poorly performed Distribution of IQ Scores The distribution of scores (commonly called IQ scores) on the Wechsler Adult Intelligence Scale follows an approximately normal curve, an average distribution of values. The test is regularly adjusted so that the median score is 100—that is, so that half of the scores fall above 100, and half fall below.
Positively skewed distribution 1. There are more low scores than higher score.2. It shows that test is so difficultformed an asymmetrical distributionmean>median>mode The graph shows that the number of student who got good grades are relatively lower than those who got lower grades.. > >
Negatively skewed distribution • There are more high scores than lower score.2. It shows that test is very easy, thus even the low performer student s got good gradeformed an asymmetrical distributionmode>median>mean • Inverse of positively distribution > > The graph shows that the number of student who got high grades are relatively more than those who got lower grades..
Forms of Assessment 1. Traditional assessment- example Multiple choice, matching type, true or false completion test2. performance assessment-engage in complex task, creation of product ex. Dance step, demonstration3. Portfolio assessment-on going evaluation, involves gathering or collecting many different students progress indicators4. authentic assessment-real life criteria use of judgments
THANK YOU! PREPARED BY MR. BOYET B. ALUAN