Download
1 / 1
10 likes | 78 Vues
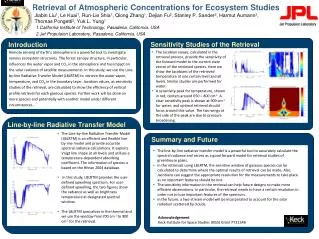
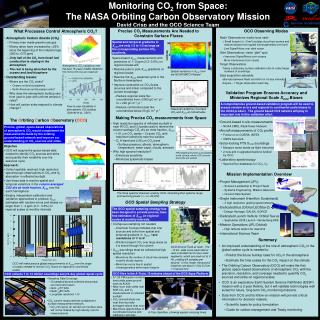
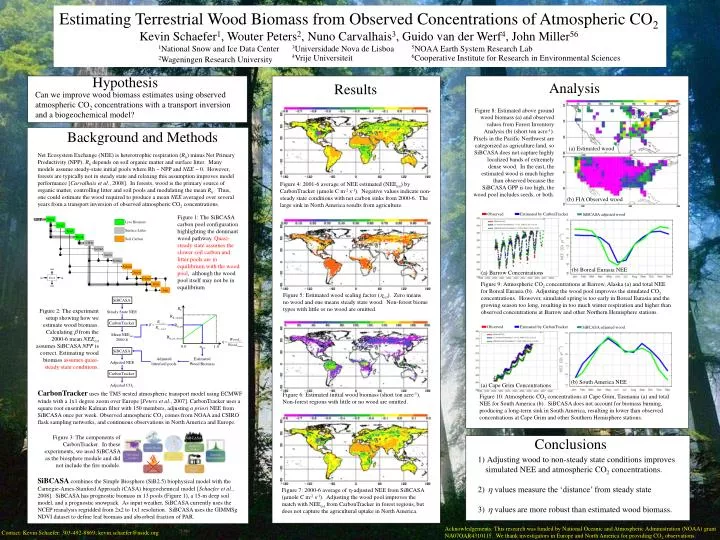
R h. CarbonTracker. CarbonTracker. Store. Steady State NEE. Pool. Leaf. R h_steady. Root. R h_est. Wood. CWD. Soilmet. Mean NEE est 2000-6. R h_no_wood. Soilmic. SiBCASA. SiBCASA. Soilstr. 0.0. h est. 1.0. Arm. Slow. Surfmet. Adjusted litter/soil pools.

E N D
Rh CarbonTracker CarbonTracker Store Steady State NEE Pool Leaf Rh_steady Root Rh_est Wood CWD Soilmet Mean NEEest 2000-6 Rh_no_wood Soilmic SiBCASA SiBCASA Soilstr 0.0 hest 1.0 Arm Slow Surfmet Adjusted litter/soil pools Estimated Wood Biomass Adjusted NEE Surfstr Surfmic Adjusted CO2 Observed Observed Estimated by CarbonTracker Estimated by CarbonTracker SiBCASA adjusted wood SiBCASA adjusted wood GPP Live Biomass Surface Litter Soil Carbon out in in out SiBCASA Estimating Terrestrial Wood Biomass from Observed Concentrations of Atmospheric CO2 Kevin Schaefer1, Wouter Peters2, Nuno Carvalhais3, Guido van der Werf4, John Miller56 1National Snow and Ice Data Center 3Universidade Nova de Lisboa 5NOAA Earth System Research Lab 4Vrije Universiteit 6Cooperative Institute for Research in Environmental Sciences 2Wageningen Research University Hypothesis Analysis Results Can we improve wood biomassestimatesusing observed atmospheric CO2 concentrations with a transport inversion and a biogeochemical model? Figure 8: Estimated above ground wood biomass (a) and observed values from Forest Inventory Analysis (b) (short ton acre-1). Pixels in the Pacific Northwest are categorized as agriculture land, so SiBCASA does not capture highly localized bands of extremely dense wood.In the east, the estimated wood is much higher than observed because the SiBCASA GPP is too high, the wood pool includes seeds, or both. Background and Methods (a) Estimated wood Net Ecosystem Exchange (NEE) isheterotrophic respiration (Rh) minus Net Primary Productivity (NPP). Rh depends on soil organic matter and surface litter. Many models assume steady-state initial pools where Rh~NPP and NEE~ 0. However, forests are typically not in steady state and relaxing this assumption improves model performance [Carvalhais et al., 2008]. In forests, wood is the primary source of organic matter, controlling litter and soil pools and modulating the mean Rh. Thus, one could estimate the wood required to produce a mean NEE averaged over several years from a transport inversion of observed atmospheric CO2 concentrations. Figure 4: 2001-6 average of NEE estimated (NEEest) by CarbonTracker (mmole C m-2 s-1). Negative values indicate non-steady state conditions with net carbon sinks from 2000-6. The large sink in North America results from agriculture. (b) FIA Observed wood Figure 1: The SiBCASA carbon pool configuration highlighting the dominant wood pathway. Quasi-steady state assumes the slower soil carbon and litter pools are in equilibrium with the wood pool, although the wood pool itself may not be in equilibrium (b) Boreal Eurasia NEE (a) Barrow Concentrations Figure 9: Atmospheric CO2 concentrations at Barrow, Alaska (a) and total NEE for Boreal Eurasia (b). Adjusting the wood pool improves the simulated CO2 concentrations. However, simulated spring is too early in Boreal Eurasia and the growing season too long, resulting in too much winter respiration and higher than observed concentrations at Barrow and other Northern Hemisphere stations. Figure 5: Estimated wood scaling factor (hest). Zero means no wood and one means steady state wood. Non-forest biome types with little or no wood are omitted. Figure 2: The experiment setup showing how we estimate wood biomass. Calculating b from the 2000-6 mean NEEest assumes SiBCASA NPP is correct. Estimating wood biomass assumes quasi-steady state conditions. (b) South America NEE (a) Cape Grim Concentrations CarbonTracker uses the TM5 nested atmospheric transport model using ECMWF winds with a 1x1 degree zoom over Europe [Peters et al., 2007]. CarbonTracker uses a square root ensemble Kalman filter with 150 members, adjusting a priori NEE from SiBCASA once per week. Observed atmospheric CO2 comes from NOAA and CSIRO flask sampling networks, and continuous observations in North America and Europe. Figure 6: Estimated initial wood biomass (short ton acre-1). Non-forest regions with little or no wood are omitted. Figure 10: Atmospheric CO2 concentrations at Cape Grim, Tasmania (a) and total NEE for South America (b). SiBCASA does not account for biomass burning, producing a long-term sink in South America, resulting in lower than observed concentrations at Cape Grim and other Southern Hemisphere stations. Figure 3: The components of CarbonTracker. In these experiments, we used SiBCASA as the biosphere module and did not include the fire module. Conclusions • Adjusting wood to non-steady state conditions improves simulated NEE and atmospheric CO2 concentrations. • h values measure the ‘distance’ from steady state • h valuesare more robust than estimated wood biomass. SiBCASAcombines the Simple Biosphere (SiB2.5) biophysicalmodelwith the Carnegie-Ames-Stanford Approach (CASA) biogeochemical model [Schaefer et al., 2008]. SiBCASA has prognostic biomass in 13 pools (Figure 1), a 15-m deep soil model, and a prognostic snowpack. As input weather, SiBCASA currently uses the NCEP reanalysis regridded from 2x2 to 1x1 resolution. SiBCASA uses the GIMMSg NDVI dataset to define leaf biomass and absorbed fraction of PAR. Figure 7: 2000-6 average of h-adjusted NEE from SiBCASA (mmole C m-2 s-1). Adjusting the wood pool improves the match with NEEest from CarbonTracker in forest regions, but does not capture the agricultural uptake in North America. Acknowledgements: This research was funded by National Oceanic and Atmospheric Administration (NOAA) grant NA07OAR4310115. We thank investigators in Europe and North America for providing CO2 observations. Contact: Kevin Schaefer: 303-492-8869; kevin.schaefer@nsidc.org