Download
1 / 78
780 likes | 807 Vues
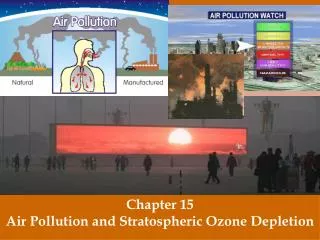
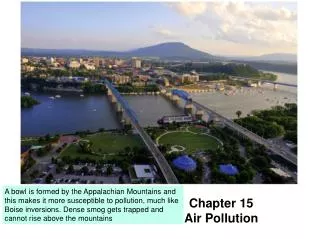
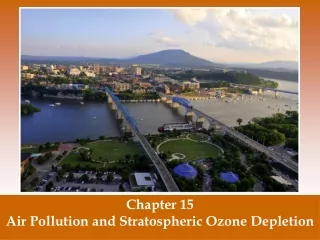
Chapter 15 Air Pollution and stratospheric Ozone. Pollution Thorpe, Gary S., M.S., (2002). Barron’s How to prepare for the AP Environmental Science Advanced Placement Exam. The term “Smog” (smoke and fog) was first used in 1905 to describe sulfur dioxide emission

E N D
PollutionThorpe, Gary S., M.S., (2002). Barron’s How to prepare for the AP Environmental Science Advanced Placement Exam • The term “Smog” (smoke and fog) was first used in 1905 to describe sulfur dioxide emission • In 1952, severe pollution took the lives of 5000 people in London www.aqmd.gov/pubinfo/ 97annual.html
TheCleanAirAct Congress found: • Most people now live in urban areas • Growth results in air pollution • Air pollution endangers living things It decided: • Prevention and control at the source was appropriate • Such efforts are the responsibility of states and local authorities • Federal funds and leadership are essential for the development of effective programs
Clean Air Act • Air Pollution Control Act – 1955 – congress passed a series of laws • Originally signed 1963 • States controlled standards • 1970 – Uniform Standards by Federal Govt. • Criteria Pollutants • Primary – Human health risk • Secondary – Protect materials, crops, climate, visibility, personal comfort
Clean Air Act • 1990 version • Acid rain, urban smog, toxic air pollutants, ozone depletion, marketing pollution rights, VOC’s • 1997 version • Reduced ambient ozone levels • Cost $15 billion/year -> save 15,000 lives • Reduce bronchitis cases by 60,000 per year • Reduce hospital respiratory admission 9000/year
Anthropogenic Sources of Air Pollution • Figure shows criteria and other air pollutant trends. Trends in the criteria air pollutants in the U.S. between 1900 and 2008. All criteria air pollutants have decreased during this time period. The decrease for lead is the greatest.
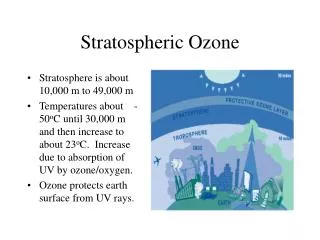
Air Pollutants – gases and particulate material added to the atmosphere that can affect climate or harm people. • Mostly refers to pollution in the tropospher, first 16 km. • Air pollution – can occur naturally from sources such as volcanoes and fires or anthropogenic (automobiles or industries) Types: Outdoor and Indoor
Primary and Secondary Pollutants • Primary – Pollutants that come directly from smoke stacks, exhaust pipes and natural emissions. • pollutants that are directly harmful or can produce harmful compounds. (CO, CO2, SO2 NOX, and suspended particles) • Secondary – Primary pollutants that have undergone transformation in the presence of sunlight, water, oxygen or other compounds. Harmful substances produced when primary pollutants interact or react with constituents of the atmosphere.
Major Sources of Primary Pollutants Stationary Sources • Combustion of fuels for power and heat – Power Plants • Other burning such as Wood & crop burning or forest fires • Industrial/ commercial processes • Solvents and aerosols Mobile Sources • Highway: cars, trucks, buses and motorcycles • Off-highway: aircraft, boats, locomotives, farm equipment, RVs, construction machinery, and lawn mowers
Human Impact on Atmosphere • Adds CO2 and O3 to troposphere • Global Warming • Altering Climates • Produces Acid Rain • Releases NO, NO2, and NH3 into troposphere • Produces acid rain • Releases SO2 into troposphere • Releases toxic heavy metals (Pb, Cd, and As) into troposphere • Burning Fossil Fuels • Using Nitrogen fertilizers and burning fossil fuels • Refining petroleum and burning fossil fuels • Manufacturing www.dr4.cnrs.fr/gif-2000/ air/products.html
Major Air Pollutants • The atmosphere is a public commons. The science of air pollution is intertwined with legislation and social perspective. • EPA identifies 6 criteria air pollutants.
Criteria Air Pollutants EPA uses six "criteria pollutants" as indicators of air quality – judged to pose great risk! • Nitrogen Dioxide: NO2 • Tropospheric Ozone: ground level O3 • Carbon Oxides: CO and CO2 • Lead and other metals: Pb • Particulate Matter: PM10 (PM 2.5) • Sulfur Dioxide: SO2 • Volatile Organic Compounds: (VOCs) EPA established for each concentrations above which adverse effects on health may occur
Sulfur Dioxide (SO2) • Properties: colorless gas with irritating odor • Effects: produces acid rain (H2SO4), breathing difficulties, eutrophication due to sulfate formation, lichen and moss are indicators • Sources:burning high sulfur coal or oil, smelting or metals, paper manufacture, volcanic eruptions and forest fires. • Class: sulfur oxides • EPA Standard: 0.3 ppm (annual mean) • Combines with water and NH4 to increase soil fertility
Nitrogen Dioxide (NO2) • Properties: reddish brown gas, formed as fuel burnt in car, strong oxidizing agent, forms Nitric acid in air, highly reactive • Effects: acid rain, lung and heart problems, decreased visibility (yellow haze), suppresses plant growth • Sources:fossil fuels combustion @ higher temperatures, lightning, power plants, forest fires, volcanoes, bacteria in soil • Class: Nitrogen oxides (NOx) (NO and NO2) • EPAStandard: 0.053 ppm
Carbon Monoxide (CO) • Properties:colorless, odorless, heavier than air, 0.0036% of atmosphere • Effects:binds tighter to Hgb (hemoglobin) than O2, mental functions and visual acuity, even at low levels • Sources:incomplete combustion of fossil fuels 60 - 95% from auto exhaust • Class:carbon oxides (CO2, CO) • EPAStandard:9 ppm • 5.5 billion tons enter atmosphere/year
Suspended Particulate Matter (PM10) • Properties: Solid and liquid particles suspended in air (<10 um) • Effects: lung damage, mutagenic, carcinogenic, teratogenic • Sources:burning coal or diesel, volcanoes, factories, unpaved roads, plowing, lint, pollen, spores, burning fields • Class: SPM: dust, soot, asbestos, lead, PCBs, dioxins, pesticides • EPA Standard: 50 ug/m3 (annual mean)
Photochemical Oxidants/Tropospheric Ozone • Photochemical Oxidants – a class of chemicals formed as a result of sunlight acting on compounds such as nitrogen oxides and sulfur dioxides. • Smog – smoke and fog it gives the hazy view and reduced sunlight observed in many cities.
Photochemical Oxidants/Tropospheric Ozone • Photochemical smog – is dominated by oxidants such as ozone (LA smog)/brown smog and sulfurous smog (dominated by sulfate compounds. • London-type Smog or gray smog- atmospheric brown cloud. This is caused by a combination of particulate matter and ozone. Derived from combustion of fossil fuels and burning biomass.
Thermal Inversions • Thermal Inversion- when a relatively warm layer of air at mid-altitude covers a layer of cold, dense air below. • The warm inversion layer traps emissions that then accumulate beneath it. • Thermal inversions that create pollution events are particularly common in some cities, where high concentration of vehicles exhaust and industrial emissions are easily trapped by the inversion layer.
Thermal Inversions • Figure 15.8 shows a before and after picture of thermal inversion. (a) Under normal conditions, where temperatures decrease with increasing altitude, emissions rise into the atmosphere. (b) When a mid-altitude relatively warm inversion layer blankets a cooler layer, emissions are trapped and accumulate.
Formation & Intensity Factors • Local climate (inversions, air pressure, temperature, humidity) • Topography (hills and mountains) • Population density • Amount of industry • Fuels used by population and industry for heating, manufacturing, transportation, power • Weather: rain, snow,wind • Buildings (slow wind speed) • Mass transit used • Economics
Smog Forms ...when polluted air is stagnant (weather conditions, geographic location) Los Angeles, CA
Industrial Smog • Gray air smog • When coal or oil are burned • Some completely combusted forming CO2 • Some partially combusted forming CO • Some remain unburned and makes soot or particles of carbon • Contaminants like mercury and sulfur • These chemicals can produce further harmful reactions
NO3 2 – – SO4 Primary Pollutants CO CO2 Secondary Pollutants SO2 NO NO2 SO3 Most hydrocarbons HNO3 H2SO4 Most suspended particles H2O2 O3 PANs and salts Most Natural Sources Stationary Mobile
Photochemical Smog • Process whose activation requires light • Brown Air smog formed by light driven reactions of primary pollutants and normal atmospheric compounds that produce 100 different chemicals. • High levels of NO2
Photochemical Smog Secondary Pollutants HNO3 O3 nitric acid ozone Photochemical Smog UV radiation H2O + O2 Primary Pollutants NO2 + Hydrocarbons Auto Emissions
Tropospheric Ozone (O3) • Properties: colorless, unpleasant odor, major part of photochemical smog • Effects: lung irritant, damages plants, rubber, fabric, eyes, 0.1 ppm • Sources: Created by sunlight acting on NOx and VOC , photocopiers, cars, industry, gas vapors, chemical solvents, incomplete fuel combustion products • Class: photochemical oxidants, secondary pollutant
Tropospheric Ozone (O3) • 10,000 to 15,000 people in US admitted to hospitals each year due to ozone-related illness • Children more susceptible • Airways narrower • More time spent outdoors
Lead (Pb) • Properties: grayish metal • Effects: accumulates in tissue; affects kidneys, liver and nervous system (children most susceptible); mental impairment; possible carcinogen; 20% of inner city kids have [high] • Sources: particulates, smelters, batteries • Class:toxic or heavy metals • EPAStandard: 1.5 ug/m3 • 2 million tons enter atmosphere/year
VOCs (Volatile Organic Compounds) • Properties: organic compounds (hydrocarbons) that evaporate easily, usually aromatic (ring structures – alternating double and single bonds) • Effects: eye and respiratory irritants; carcinogenic; liver, CNS, or kidney damage; damages plants; lowered visibility due to brown haze; global warming • Sources:vehicles(largest source),evaporation of solvents or fossil fuels, aerosols, paint thinners, dry cleaning • Class: HAPs (Hazardous Air Pollutants) • Methane • Benzene • Chlorofluorocarbons (CFCs), etc. • Concentrations indoors up to 1000x outdoors • 600 million tons of CFCs
Other Air Pollutants • Carbon dioxide • ChloroFluoroCarbons • Formaldehyde • Benzene • Asbestos • Manganese • Dioxins • Cadmium • Others not yet fully characterized
Montreal Protocol • In response to scientific concerns, international policy efforts to restrict CFC (Cloro-fluro Carbons) production • Treaty to cut CFC’s in half • To date, production and use of CFC’s have fallen 95% • However, United States did not sign
Indoor Air Pollution • In general indoor pollutants are higher then outdoor, so more of a problem • Developing World – fuel burning cause • Developed World – tobacco smoke and radon casues • VOC’s – plastics, oils, perfumes, paints, cleaners, adhesives, pesticides, building materials, carpets, laser printers, fax machines and more
Why is indoor air quality important? • 70 to 90% of time spent indoors, mostly at home • Many significant pollution sources in the home (e.g. gas cookers, paints and glues) • Personal exposure to many common pollutants is driven by indoor exposure • Especially important for susceptible groups – e.g. the sick, old and very young
Exposure • Time spent in various environments in US and less-developed countries