Download
1 / 87
870 likes | 1.04k Vues
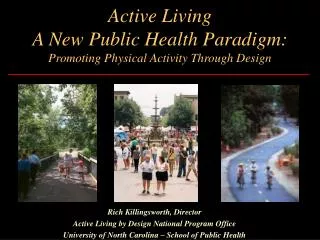
Active Living A New Public Health Paradigm: Promoting Physical Activity Through Design. Rich Killingsworth, Director Active Living by Design National Program Office University of North Carolina – School of Public Health. Focus of Today’s Discussion on Active Living. History Assumptions

E N D
Active LivingA New Public Health Paradigm:Promoting Physical Activity Through Design Rich Killingsworth, Director Active Living by Design National Program Office University of North Carolina – School of Public Health
Focus of Today’s Discussion on Active Living • History • Assumptions • Terminology • Public Health Burden of Physical Inactivity • Research Needs • Policy Needs • Practice Opportunities • Calls to Action
“The individuals who will succeed and flourish will also be masters of change: adept at reorienting their own and others’ activities in untried directions to bring about higher levels of achievement.” Rosabeth Moss Kanter
The Changing Face of Public Health 1950 - 2003 • Pre-1950: Improving Sanitation • Change zoning, clean-up slums and industrial pollution • 1950s: Eradicating Infectious Diseases • Polio, Typhoid, Malaria, etc. • 1970s: Removing Toxic Environments • Improve Air/Land/Water Quality, Love Canal, Asbestos • 1980s: Preventing Risky Lifestyles • Decrease Smoking, Drug Use, Drunk driving, etc. • 21st Century: Creating Healthy Environments • Physical Activity and Healthy Eating
The Emergence of a Sedentary Society • Automobile • Television • Computers • Convenience Engineering • Built Environment • Human Nature
Recommended Physical ActivityU.S. Adults, 1986-2000 Source: Centers for Disease Control and Prevention Behavioral Risk Factor Surveillance System
The Burden of Physical Inactivity • The Problem • 27% of adults are sedentary • 70% do not achieve recommended dose • The Public Health Burden • 64% overweight and 1 in 3 obese • CVD, Cancer, Diabetes • Physical inactivity is a primary factor in over 200,000 deaths annually. • The Economic Burden • Medical costs associated with physical inactivity may exceed $76 billion annually. Data Sources: 2000 BRFSS, 2000 NHANES, Powell 1994, Pratt et. al. 2000
No Data <10% 10%-14% 15-19% 20% Obesity* Trends Among U.S. AdultsBRFSS, 1985 (*BMI 30, or ~ 30 lbs overweight for 5’4” person)
No Data <10% 10%-14% 15-19% 20% Obesity* Trends Among U.S. AdultsBRFSS, 1986 (*BMI 30, or ~ 30 lbs overweight for 5’4” person)
No Data <10% 10%-14% 15-19% 20% Obesity* Trends Among U.S. AdultsBRFSS, 1987 (*BMI 30, or ~ 30 lbs overweight for 5’4” person)
No Data <10% 10%-14% 15-19% 20% Obesity* Trends Among U.S. AdultsBRFSS, 1988 (*BMI 30, or ~ 30 lbs overweight for 5’4” person)
No Data <10% 10%-14% 15-19% 20% Obesity* Trends Among U.S. AdultsBRFSS, 1989 (*BMI 30, or ~ 30 lbs overweight for 5’4” person)
No Data <10% 10%-14% 15-19% 20% Obesity* Trends Among U.S. AdultsBRFSS, 1990 (*BMI 30, or ~ 30 lbs overweight for 5’4” person)
No Data <10% 10%-14% 15-19% 20% Obesity* Trends Among U.S. AdultsBRFSS, 1991 (*BMI 30, or ~ 30 lbs overweight for 5’4” person)
No Data <10% 10%-14% 15-19% 20% Obesity* Trends Among U.S. AdultsBRFSS, 1992 (*BMI 30, or ~ 30 lbs overweight for 5’4” person)
No Data <10% 10%-14% 15-19% 20% Obesity* Trends Among U.S. AdultsBRFSS, 1993 (*BMI 30, or ~ 30 lbs overweight for 5’4” person)
No Data <10% 10%-14% 15-19% 20% Obesity* Trends Among U.S. AdultsBRFSS, 1994 (*BMI 30, or ~ 30 lbs overweight for 5’4” person)
No Data <10% 10%-14% 15-19% 20% Obesity* Trends Among U.S. AdultsBRFSS, 1995 (*BMI 30, or ~ 30 lbs overweight for 5’4” person)
No Data <10% 10%-14% 15-19% 20% Obesity* Trends Among U.S. AdultsBRFSS, 1996 (*BMI 30, or ~ 30 lbs overweight for 5’4” person)
No Data <10% 10%-14% 15-19% 20% Obesity* Trends Among U.S. AdultsBRFSS, 1997 (*BMI 30, or ~ 30 lbs overweight for 5’4” person)
No Data <10% 10%-14% 15-19% 20% Obesity* Trends Among U.S. AdultsBRFSS, 1998 (*BMI 30, or ~ 30 lbs overweight for 5’4” person)
No Data <10% 10%-14% 15-19% 20% Obesity* Trends Among U.S. AdultsBRFSS, 1999 (*BMI 30, or ~ 30 lbs overweight for 5’4” person)
No Data <10% 10%-14% 15-19% 20% Obesity* Trends Among U.S. AdultsBRFSS, 2000 (*BMI 30, or ~ 30 lbs overweight for 5’4” person)
No Data <10% 10%-14% 15-19% 20-24% 25% Obesity* Trends Among U.S. AdultsBRFSS, 2001 (*BMI 30, or ~ 30 lbs overweight for 5’4” person)
Explaining the Epidemic: • Genetic • Medical Care • Behavioral Choices • Social Circumstances • Environmental Conditions
Syndemic Two or more epidemics, interacting synergistically, contributing to excess burden of disease in a population. http://www.cdc.gov/syndemics/index.htm
Consider the Possibility That... • the pattern of growth has upset the balance of human behavior • the social costs of development may be far more reaching than traffic congestion • most new communities we have developed may not be “safe” and “healthy” • there may be another way
Advancing the Concept of Active Living Active Living is a way of life that integrates physical activity into daily routines.
We Are Where We Live • There is a dynamic interplay of social and individual factors in a mutual and complex system • Behavior is guided by settings, socio-cultural scripts, and cognitions of the environment
Transportation Alternative Transportation Healthy Environments and Active People Physical Activity Healthy Places and Spaces Health Environment
Transportation, Land Use and Health in the News • Taking Back the Street • Suburbia’s Road to Weight Gain • Link Between Sprawl and Obesity • Pedestrians Pushing Back • Land Use Discourages Walking The Detroit News
The Burden of an Asphalt Nation • $200 Million Per Day spent constructing new roads • $22 Billion Per Year on routine maintenance of roads • $7 Billion Per Year for interest and debt retirement • Yet the dependency continues • 73 minutes per day in our cars • 25% of all trips within a mile, but 75% of these trips are auto-based Source: Federal Highway Administration Transportation Data 1995
Non-Motorized Trips 1977-1995Nationwide Personal Transportation Survey - USDOT
Physical Inactivity and Overweight Trends Among Youth • 1 in 6 Youth ages 6-19 is Overweight • 1 in 3 high school youth do not engage in vigorous physical activity • Less than 30% attend daily physical education • Children watch more t.v. in a year than attend school Data Sources: 2000 YRBSS, 2000 NHANES, 2002 National TV Turnoff Week Data
The Disappearing Walk to School • 1 in 4 trips made by 5-15 year olds are for the journey to and from school. • Only 10% of these trips are made by walking and bicycling. • Of school trips one mile or less, about 28% are walk-based and less than 1% are bike-based. Source: Federal Highway Administration Transportation Data 1995
Children Are Walking Less and Becoming Increasingly Overweight
Barriers to Active Living in Low Income Communities • Crime • Poorly maintained infrastructure • Poor streetscapes • Abandoned or unsafe parks • Disconnected sidewalks • Absence of service facilities • Grocery, post office, library • Neighborhoods divided by highways • Limited access to destinations of interest • Isolation from the larger community
Potential vs. Effective Environments • Physical Fallacy • If you build it will they come? • Function and Meaning • Is it designed to be used the way it is understood to be used? • Social and Cultural Norms • Targeting the facility to the population who will use it, but also to those who need it most.
Factors that Influence Active Transportation • Land Use Mix • Network Connectivity • Street Design • Site Design • Density • Beliefs • Crime • Safety
The Influence of Location on Non-Motorized Travel Behavior • Urban 17.7% • 2nd City 6.2% • Suburban 4.5% • Rural 3.9% Location % of Trips Walk/Bike Data Source: 1995 NPTS - 40 metropolitan statistical areas
1973 1979 1987 1997 25 Years of Urban Growth in Atlanta Source: Scientific Visualization Studio, Goddard Space Flight Center
Leveling Atlanta Metro Atlanta loses 58 acres of forested land a day to “development,” Source: Georgia Department of Natural Resources.
LowDensity Big, Segregated Single-Use Zones SparseStreet Network Lack of Centers
Impact of Community Design on Activity Sources: Cambridge Systematics 1994; UNC-Highway Safety Research Center 1994; EPA/CDC Greenstyles Survey 1999; Nebraska Social Indicators Survey 1999