Download
1 / 18
180 likes | 283 Vues
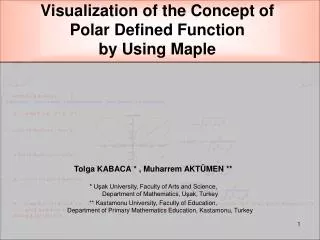
Visualization of the Concept of Polar Defined Function by Using Maple. Tolga KABACA * , Muharrem AKTÜMEN ** * Uşak University, Faculty of Arts and Science, Department of Mathematics, Uşak, Turkey

E N D
Visualization of the Concept of Polar Defined Function by Using Maple Tolga KABACA * , Muharrem AKTÜMEN ** * Uşak University, Faculty of Arts and Science, Department of Mathematics, Uşak, Turkey ** Kastamonu University, Faculty of Education, Department of Primary Mathematics Education, Kastamonu, Turkey
COMPUTER ALGEBRA SYSTEM • Computer algebra systems have great potential for professional engineers, scientists and technologists. • CAS can reduce the tedium of routine manipulation required in some mathematical models and procedures, give a greater assurance of accuracy, and even enable users to apply techniques which they might find difficult without such assistance [1]. • Also (CAS) potentially offer students a powerful tool which is used in mathematics education.
COMPUTER ALGEBRA SYSTEM • According to Majewski (1999) CAS should help us to: • 1. Expand our computational power • 2. Explore mathematical concepts • 3. Experiment with mathematical concepts • 4. Visualize mathematical objects • 5. Prepare and publish teaching materials • 6. Improve communication between teacher and student • 7. Present concepts online and support distance education • 8. Test and train students
COMPUTER ALGEBRA SYSTEM • In our study; • We have observed that one of the challenging issues, in calculus courses, is polar coordinates and graphing polar functions’ curves. • We have developed an illustration to make this concept clearer. • In general, students believe that polar coordinates and Cartesian coordinates are completely different concepts. • Especially, traditional method of drawing a polar defined function does not make any sense in students’ mind.
POLAR COORDINATES • I mean, by traditional method, finding some polar points and connecting them continuously. • Since we don’t use same method while drawing a Cartesian defined function, the relationship, between Cartesian and polar defined function, can not be realized clearly. • Actually, both of them are very similar. Only difference is identifying style of a point in IR plane. • Computers’ method of drawing method of a curve can help us. Because Computers use same method while drawing all kind of functions. 2
POLAR COORDINATES Let’s try to make our students meet a contradiction
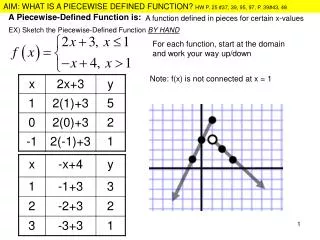
y (x, y) 0 x WHAT IS THE DIFFERENCE BETWEEN TWO GRAPHS? LET’S OBSERVE HOW THE GRAPHS ARE BEING FORMED…..
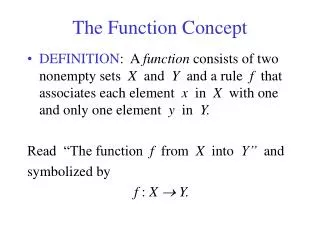
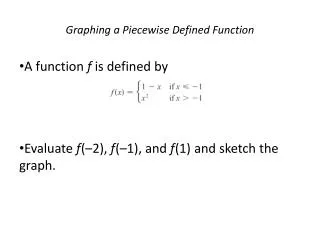
(x, f(x)) = (rcos, rsin) r y (x, y) 0 x COORDINATES P P since the mission of variables is not same let’s call them differently…
COORDINATES • Let’s define Cartesian function y = f(x) = 1 + sin(x) in polar coordinates and observe the following graphs. • Let’s also define the polar function r = f() = 1 + sin() in Cartesian coordinates and observe the following graphs. Now, we can provide an opportunity to observe how a polar or a cartesian function is being formed for our students.
Conclusion • Even if students know the difference of the role of the variables (x,y) and (,r) theoritically, the application was confusing for them. At the end of this visualisation, we observed a deeper insight. • We gave some complicated polar curves (e.g. rose curves) to students to draw them by using paper and pencil techique. By the help of last worksheet, our students find a lot of opportunity of cheking their graphs and observing the relationship between the independent variable and dependent variable r interactively. • Especially engineering students had showed great attraction for this interactive application. 16
References • Clements, R. (1999). Essential Mathematical Concepts Needed by User of Computer Algebra. Teaching Mathematics and its Applications, Volume 18. No 4. • Majewski. M., (1999). Pitfalls and Benefits of the use of Technology in Teaching Mathematics, Proceedings of the Asian Technology Conference in Mathematics, 52-59.
Thank you for your Attention! For further information please contact Tolga KABACA; tolgakabaca@yahoo.com 18