Download
1 / 34
340 likes | 503 Vues
Trends and Tools in International Humanitarian Assistance and Cooperation. Presentation to Global Trends and Diversity course IUHEID 15 October 2008. Overview. Some basic definitions OCHA Humanitarian appeals (flash appeals, consolidated appeals, CERF)

E N D
Trends and Tools in International Humanitarian Assistance and Cooperation Presentation to Global Trends and Diversity course IUHEID 15 October 2008
Overview • Some basic definitions • OCHA • Humanitarian appeals (flash appeals, consolidated appeals, CERF) • Responding to emergencies: the challenges of coordination • Questions…
Themes • Humanitarian v development • Preparedness and prevention v response • Coordination • Advocacy
Some basic definitions 1/2 • ODA: flows to developing countries and multilateral institutions provided by official (government) agencies that is i) administered with the promotion of the economic development and welfare of developing countries as its main objective; ii) concessional in character • Humanitarian assistance: assisting people in need, providing goods and services free of charge within a defined timeframe • Development aid: empowering people, takes time to pay dividends, and is adamantly opposed to handouts
Some basic definitions 2/2 Early recovery*: a multidimensional process guided by development principles: • begins in a humanitarian setting, and seeks to build on humanitarian programmes and catalyze sustainable development opportunities. • aims to generate and/or reinforce nationally owned processes for post-crisis recovery that are resilient and sustainable. • Encompasses the restoration of basic services, livelihoods, transitional shelter, governance, security and rule of law, environment and other socio-economic dimensions, including the reintegration of displaced populations. • Strengthens human security and aims to begin addressing the underlying causes of the crisis. *Source: Cluster Working Group on Early Recovery; Guidance Note on Early Recovery, April 2008
OCHA Established in 1991, with a mandate to mobilise and coordinate effective andprincipled humanitarian action in partnership with national and international actors • Coordinates humanitarian relief • Helps affected populations • Promotes preparedness and prevention; responds to sudden onset crises • Raises funds for emergencies and disasters
ConsolidatedAppeals (CAPs) CAPs were established in 1992 (catalyst was the Kurdish refugee crisis), OCHA has the task of managing CAP development • CAPs are the principal tool for humanitarian coordination, strategic planning and programming. CAPs contain: • an overview of the context, humanitarian consequences, and life-saving needs. • needs assessment information, a common humanitarian action plan, and specific sectoral response plans and budgeted projects. • address acute needs for a year, and can be revised/extended as needed.
CAP Section The section leads and contributes to supporting strategic, accountable and inclusive humanitarian planning through: • Improving the prioritisation of funding for donors and humanitarian country teams by advocating, providing and contributing to the development of integrated/complimentary tools and policy guidance as chair of the CAP Sub-Working Group; • Supporting OCHA’s field offices in the development, review, editing, formatting, publishing and delivering of strategic and inclusive humanitarian appeals/plans (CAPs and flash appeals) • Tracking and monitoring of humanitarian funding data through the Financial Tracking Service (FTS) in support of advocacy and coordination; and • Ensuring that CAP is aligned with global humanitarian financing efforts including linkages with CERF.
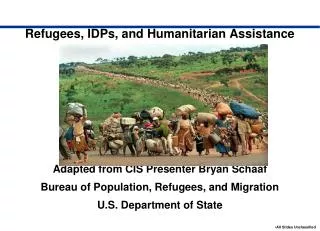
What Warrants an Appeal? • Any crisis or disaster needing a humanitarian response that (a) exceeds the capacity of the affected country government, and (b) exceeds the capacity and/or mandate of any one UN agency • For 2008, there are CAPs in CAR, Chad, Cote d’Ivoire, DRC, Iraq, Nepal*, oPt, Somalia, Sri Lanka*, Sudan, Timor Leste*, Uganda, West Africa, & Zimbabwe • *CAP or euphemised equivalent: used when the affected government, for whatever reason, acknowledges the assistance a CAP can bring but does not want the ‘brand’. • Most appeals are and have been in Africa
Who Is Involved? • Resident/Humanitarian Coordinator (leading the process, with OCHA’s support) • UN Agencies (e.g. UNHCR, UNICEF, WFP) • Red Cross/Red Crescent Movement • NGOs (international and local) • Donors (field office reps) Agencies will usually be organised into sectoral (or cluster) groupings: saves time, effort, information is shared, gaps spotted and covered.
Funding In 2008 so far, donors have given $8,350,397,802 in humanitarian aid to all emergencies (including CAPs, flash appeals, bilateral aid, etc) • $4,339,753,132* has gone to CAPs/FAs (49%), which have requested a total of $7,274,918,553 For previous years Total humanitarian funding Total CAP/FA funding 2007: $7,733,232,133 $3,713,801,351 (48%) 2006: $7,499,265,709 $3,375,159,303 (45%) 2005: $13,155,298,366 $4,029,163,415 (30%) 2004: $4,734,344,385 $2,191,290,639 (46%) Global humanitarian funding is holding fairly steady; the share of that captured by CAPs is also holding steady. CAPs seem able to reach a certain threshold but not beyond. Whether there is the capacity in the aid system to handle the total amount of humanitarian funding is an interesting question. *Includes CAPs and euphemised equivalents (see slide 9)
Funding by Sector Funding is tracked by sector (e.g. food, health, shelter, water & sanitation). For 2008: • Food $3,586,122,134 42.9 % • Multi-sector $505,648,824 18.0 % • Sector not specified $655,512,117 7.8 % • Health $663,127 6.8 % • Coordination $483,773,938 5.8 % • All other sectors share $1,556,990,322 Sectors allow us to group the response, and to aggregate across crises Source: Financial Tracking Service
So Who Gets What For 2008 so far • WFP & partners $3,454,473,934 41.7 % • UNHCR $719,341,005 8.6 % • UNICEF $479,118,066 5.7 % • Bilateral $308,361,245 3.7 % • ICRC $305,862,593 3.7% Highest ranked NGO is CARE with $132,741,416 (1.6%) For 2007, and other years, the same pattern is visible The sectoral results (from the previous slide) map very closely onto the organisational ones Source: Financial Tracking Service
Who Gives What Like other trends, the major humanitarian donors remain more or less the same Donor Humanitarian funding % total • United States $1,875,473,575 24.3 % • ECHO $1,058,650,492 13.7 % • United Kingdom $459,543,946 5.9 % • Norway $438,011,513 5.7 % • Netherlands $406,231,651 5.3 % Source: Financial Tracking Service
Inside vs Outside CAPsCrises with consolidated or flash appeals in 2006: Proportion of overall humanitarian funding going to projects included in appeals, per donor (among top 15 humanitarian donors to these crises): Donor Appeal funding non-Appeal funding Total % to appeal Japan $105 million $15 million $120 million 88% Netherlands $106 million $29 million $135 million 79% Canada $57 million $17 million $74 million 77% United Kingdom $238 million $74 million $313 million 76% Australia $27 million $9 million $36 million 75% EC $338 million $117 million $454 million 74% United States $829 million $376 million $1,204 million 69% Sweden $104 million $79 million $183 million 57% Ireland $29 million $23 million $52 million 56% Norway $79 million $63 million $142 million 56% France $20 million $21 million $41 million 48% Switzerland $19 million $30 million $49 million 39% Germany $30 million $55 million $85 million 35% Denmark $22 million $50 million $72 million 31% Saudi Arabia $9 million $62 million $71 million 12% This table shows the degree of variation among the funding patterns of major donors: CAPs are managing to ‘capture’ most funding (signs of both good advocacy on the part of OCHA and wider humanitarian community, and a sign of faith by the donor community in the coordinated concept of a CAP). Analysis of funding helps to provide good measurements of donor performance to humanitarian crises. Source: Financial Tracking Service
Appeal funding as % of GNI (2006)The global standard is to reach 0.7% of GNI by 2015; total ODA as a % of GNI for all OECD countries has never passed 0.33% (2005, Tsunami)Source: Financial Tracking Service
A Widening Gap(Source: OECD, extracted from www.globalissues.org)Although rich countries have given an enormous $2.6 trillion dollars in aid since 1960, the accumulated total shortfall in their aid since 1970 (when the target of 0.7% was set) amounts to $3.3 trillion (at 2006 prices).
Central Emergency Response Fund A UN stand-by fund to enable more timely and reliable humanitarian assistance to those affected by natural disasters and armed conflicts. Approved by consensus by the UNGA on 15 December 2005 to achieve the following objectives: • promote early action and response to reduce loss of life; • enhance response to time-critical requirements; • strengthen core elements of humanitarian response in underfunded crises The fund should be $500 million, under the control of the ERC. On average, it stands at $450 million. Giving the UN control of such a flexible funding source has greatly helped improve coordination, advocacy, and the use of common principles.
The Impact of CERF 1/2(CAPs as of September 2006 [before CERF allotments])CERF was able to even out funding patternsSource: Financial Tracking Service
The Impact of CERF 2/2(Flash appeals in 2007)CERF provided essential start-up funds for operationsSource: Financial Tracking Service
Funding for Natural Disasters Funding has been increasing, as have Flash Appeals to deal with them Total aid for disasters • 2008: $920,728,357 • 2007: $807,210,842 • 2006: $257,294,600 • 2005: $7,623,463,008 • 2004: $597,082,735 • 2003: $57,968,337 The number of disasters is increasing, possibly as a result of a combination of better reporting and increasing climate change. With the increase in disasters comes increased awareness of and demand for an international humanitarian response. Disaster response is one of the areas where CERF is playing a critical role. It is also a point of friction between humanitarian and development actors, as most disasters taken place in development-orientated countries with little/no experience of humanitarian response mechanisms and procedures. Source: Financial Tracking Service
Myanmar Flash Appeal Requested $464 million / Funding is $247 million / Coverage is 53.2% Development-orientated country • Cyclone hit in the most remote, but the most productive, region of the country. • Myanmar run by a repressive, secretive regime that was deeply suspicious of international humanitarian aid. • Enormous logistical difficulties in accessing the affected area, compounded by the position of the government. • Presence of non-traditional donors (China, India, ASEAN) that had little experience of international humanitarian operations and response mechanisms (but could/did influence the Myanmar Government in the relief effort’s favour). • Discussion of forcing aid in was a total distraction from the real issue, which was to negotiate access with the regime.
Case study: Georgia 2008Map from 2008 Georgia Crisis Flash Appeal
Requested $109 million / Funding $35 million / Coverage $32.1% Long-term humanitarian operation in place (that was in fact winding down) taking care of IDP caseload of 220,000 from wars in the 1990s • Lightening war: started and finished in about four-five days. Humanitarian agencies did not have to deliver aid under fire. • How to get in to South Ossetia from the south (through Georgia)? Do we ignore needs in South Ossetia in favour of recognising Georgian territorial integrity, or acknowledge ‘realities’ on the ground and go in from the north (through Russia)? • Limits to humanitarian action when one of the permanent members of the Security Council is involved. • Buffer zone: scene of continued ethnically-motivated incidents by South Ossetian militia that were not curtailed by Russian troops, requiring continuous advocacy. • How to deal with the new caseload of 128,000 IDPs on top of the old? Posed a serious ethical question.
Requested $394 million / Funding $263 million / Coverage $66.7% Ongoing deconstruction of Zimbabwean infrastructure, economy and society. • Political and election-related violence severely curtail aid operations (humanitarian and development) • Some shocking indicators: of a population of apx. 11,900,000: • population with HIVAIDS: about 1,300,000; • Orphans: about 1,600,000; • people who will need food aid until March/April 2009: up to 5,100,000; • Internal migrants (IDPs): unknown number, but thought to be very high; • population abroad: about 3,000,000 [targeted by violence in South Africa]). • Official exchange rate of 355,000% in July; • Worsening climatic context (flooding and droughts) with much previously productive farmland now arid/desertic or increasingly underused or deserted. • Food insecurity map overlays very well the presence of these vulnerable groups. • Main issue concerns the land reforms. Donors are unwilling to, as they see it, underwrite Mugabe’s land reform through subsidising agricultural assistance. Sources for figures: 2008 Zimbabwe CAP and Mid-Year Review
Case study: Pakistan 2008Map from 2008 Pakistan Humanitarian Response Plan
Requested $55 million / Funding $12 million / Coverage 22.9% Combination of floods and conflict • Situation where the Government did not really want the UN/international agencies involved, especially not in the FATA whilst counter-insurgency operations were ongoing. • Again, significant contextual limitations to humanitarian operations: • volatile Pakistani internal politics; • American strategic interests; • instability in neighbouring Afghanistan; • Unsafe environment in which to conduct aid operations. • This is an interesting one because donors indicated that funding would be forthcoming, but it has not been. Will need to find out why. Donor interest
Thanks for listening! Any questions? Ask someone who knows what I’m doing…!! Luke McCallin Humanitarian Affairs Office/Flash Appeal Coordinator CAP Section, OCHA Geneva mccallin@un.org