Download
1 / 39
390 likes | 638 Vues
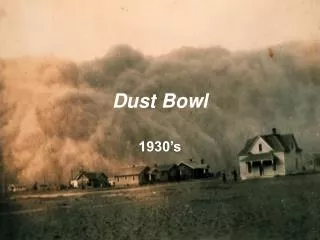
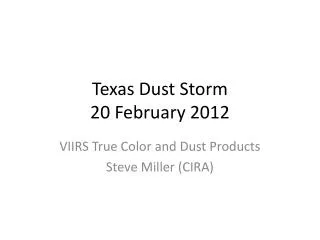
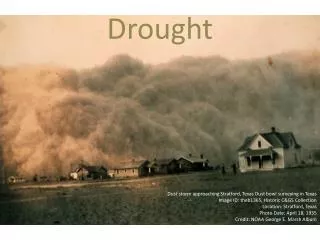
Drought. Dust storm approaching Stratford, Texas Dust bowl surveying in Texas Image ID: theb1365, Historic C&GS Collection Location: Stratford, Texas Photo Date : April 18, 1935 Credit : NOAA George E. Marsh Album. SW Monitor: Regional to global. Soil moisture percentile (-).

E N D
Drought Dust storm approaching Stratford, Texas Dust bowl surveying in Texas Image ID: theb1365, Historic C&GS Collection Location: Stratford, Texas PhotoDate: April 18, 1935 Credit: NOAA George E. Marsh Album
SW Monitor: Regional to global Soil moisture percentile (-)
Challenge: Meteorological data Three requirements: - long term data record (climatology) - near real-time reporting - consistency http://www.ncdc.noaa.gov/; Global Summary of the Day
TRMM instruments: • Precipitation Radar (PR) • TRMM Microwave Imager (TMI) • Visible and InfraRed Scanner (VIRS) • Cloud and Earth Radiant Energy Sensor (CERES) • Lightning Imaging Sensor (LIS) http://trmm.gsfc.nasa.gov/
Forcing data • Precipitation data sets used: • Sheffield et al: 1948-2008 (T and P) (SH) • TRMM V7: • Research product RP: 1/1/1998-6/30/2012 • Real-time product RT: 3/1/2000-current • available in near real-time Station-based: climatology For the purpose of this presentation, current is 12/01/2012. However, the RT and GFS4 datasets can be updated daily. Satellite + stations: spinup Satellite only: real-time • Temperature data sets used: • Sheffield et al: 1948-2008 • NCEP/NCAR Reanalysis: 1979-2011 • GFS 4: 2009-current • available in near real-time Station-based: climatology Model + stations: spinup Model + stations: real-time
The challenge • The climatological period, used to determine the soil moisture percentiles for each grid cell for a given date, is based on the period 1960-2008 (Sheffield data set) • Because soil moisture conditions in the realtime simulations are compared with those from the climatological period, systematic differences between the forcing datasets must be avoided • Correct the precipitation and temperature data sets used for the post-2008 period so that they match the Sheffield dataset (in a statistical sense) for any overlapping period
Forcing data • Wind speed values are climatological values based on a reanalysis • All other meteorological forcings needed to drive the models are estimated from the daily temperature range and precipitation • downward shortwave radiation • downwelling longwave radiation • humidity
Precipitation Adjustment • Corrections: • Match number of rainy days from RT and RP to Sheffield • Match monthly mean (ratio of long-term mean) Precipitation data available: Sheffield (1/1/1948-12/31/2008) (SH) TMPAV7 3B42 research product (1/1/1998-6/30/2012) (RP) TMPAV7 3B42RT (3/1/2000-current) (RT) Goal: Bias correct RP or RT to SH
TRMM V7 RP Correction Annual RP precipitation Annual corrected RP precipitation
TRMM V7 RT Correction Annual RT precipitation Annual corrected RT precipitation
SH/RP ratio (annual) SH/RT ratio (annual) Ratios between RT and SH are much larger (than RP and SH), because the RT data does not include station observations
Temperature Data Adjustment • Data set used: • Sheffield et al: 1948 - 2008 • NCEP/NCAR Reanalysis: 1979 - 2011 • GFS4: 2009 - Current • Individual Bias Correction on daily Tmax and Tmin to ensure temperature range is preserved • For period 2009/01 – 2012/06: • Interpolate Reanalysis data to 0.5 degrees • Calculate mean monthly Tmax and Tmin offsets from Reanalysis to Sheffield data set • Impose calculated offsets for each month on interpolated Reanalysis for this period • For RT (post 2012/06): • Interpolate GFS4 analysis data to 0.5 degrees • Calculate mean monthly Tmax and Tmin offsets from GFS4 to Reanalysis data set • Impose calculated offsets for each month on interpolated GFS4 for this period
Temperature Adjustment Results • GFS4 to Reanalysis - Before Adjustment - January Tmax and Tmin GFS4 Reanalysis
Tmax Adjusted GFS4 Data Raw Reanalysis Data Tmin Adjusted GFS4 Data Raw Reanalysis Data
Historical Drought Events • 1952 drought in the U.S. • 1965 drought in Australia • 1983 drought in Africa
1952 drought in the U.S. (GSWM upper vs SWM lower) Noah 2.8 VIC
1965 drought in Australia Noah 2.8 VIC
1983 drought in Africa Noah 2.8 VIC
Recent Drought: multimodel 2012/07/01 Note that the percentile method is very sensitive to small changes in moisture in dry regions such as the Sahara. The high percentiles (“wetness”) in that region is not realistic. In the realtime version of the global surface water monitor the desert areas of the world will be grayed out and set to “no data”
Recent Drought: individual models 2012/07/01 VIC Noah SAC
2012 Monthly Drought Information 2012/01/01 - Multimodel
2012 Monthly Drought Information 2012/02/01 - Multimodel
2012 Monthly Drought Information 2012/03/01 - Multimodel
2012 Monthly Drought Information 2012/04/01 - Multimodel
2012 Monthly Drought Information 2012/05/01 - Multimodel
2012 Monthly Drought Information 2012/06/01 - Multimodel
2012 Monthly Drought Information 2012/07/01 - Multimodel
2012 Monthly Drought Information 2012/08/01 - Multimodel
2012 Monthly Drought Information 2012/09/01 - Multimodel
2012 Monthly Drought Information 2012/10/01 - Multimodel
2012 Monthly Drought Information 2012/11/01 - Multimodel
2012 Monthly Drought Information 2012/12/01 - Multimodel
Comparison with other Drought Monitors2012/07/01 Chinese Drought and Flood Monitor UW Surface Water Monitor http://ncc.cma.gov.cn/influ/en_hljc.php
Comparison with other Drought Monitors2012/10/01 Chinese Drought and Flood Monitor UW Surface Water Monitor http://ncc.cma.gov.cn/influ/en_hljc.php
Comparison with other Drought Monitors2012/12/01 Chinese Drought and Flood Monitor UW Surface Water Monitor http://ncc.cma.gov.cn/influ/en_hljc.php
Global multimodel drought nowcasting is entirely feasible now • Consistent forcings are essential • Droughts only make sense when expressed relative to a climatology – hence climatically consistent near real-time data are essential • Skill in drought forecasting (not the focus of this talk) is critically linked to getting the initial conditions (nowcast) right ... and still a major challenge Conclusions