Download

1 / 46
460 likes | 508 Vues
Learn about the study of biological diversity in an evolutionary context, tracing phylogeny using evidence like fossils and molecular data, and distinguishing between homology and analogy in species classification.

E N D
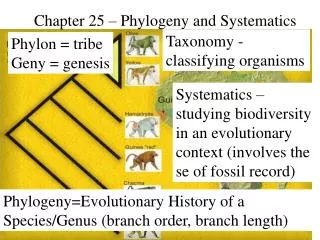
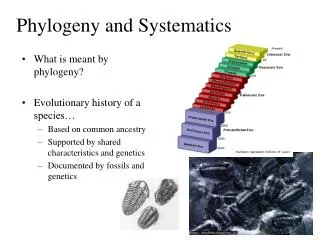
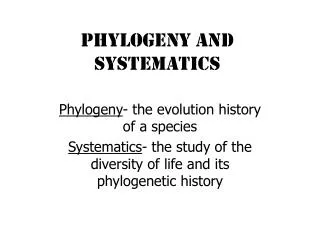
Evolutionary biology is about both processes (e.g., natural selection and speciation) and history. • A major goal of evolutionary biology is to reconstruct the history of life on earth. • Systematics is the study of biological diversity in an evolutionary context. • Part of the scope of systematics is the development of phylogeny, the evolutionary history of a species or group of related species.
To trace phylogeny or the evolutionary history of life, biologists use evidence from paleontology, molecular data, comparative anatomy, and other approaches. • Tracing phylogeny is one of the main goals of systematics, the study of biological diversity in an evolutionary context. • Systematics includes taxonomy, which is the naming and classification of species and groups of species. • As Darwin correctly predicted, “our classifications will come to be, as far as they can be so made, genealogies.”
Taxonomy employs a hierarchical system of classification • The Linnean system, first formally proposed by Linneaus in Systema naturae in the 18th century, has two main characteristics. • Each species has a two-part name. • Species are organized hierarchically into broader and broader groups of organisms.
Under the binomial system, each species is assigned a two-part latinized name, a binomial. • The first part, the genus, is the closest group to which a species belongs. • The second part, the specific epithet, refers to one species within each genus. • The first letter of the genus is capitalized and both names are italicized and latinized. • For example, Linnaeus assigned to humans the scientific name Homo sapiens.
A hierachical classification will group species into broader taxonomic categories. • Species that appear to be closely related are grouped into the same genus. • For example, the leopard, Pantherapardus, belongs to a genus that includes the African lion (Pantheraleo) and the tiger (Pantheratigris).
Phylogenetic trees reflect the hierarchical classification of taxonomic groups nested within more inclusive groups.
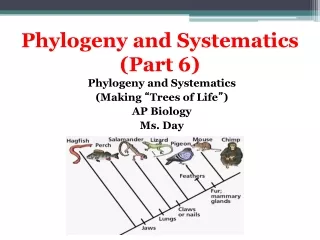
Modern phylogenetic systematics is based on cladistic analysis • A phylogeny is determined by a variety of evidence including fossils, molecular data, anatomy, and other features. • A phylogenetic diagram or cladogram is constructed from a series of dichotomies.
These dichotomous branching diagrams can include more taxa. • The sequence of branching symbolizes historical chronology. • The last ancestor common to both the cat and dog families lived longer ago than the last commonancestor shared by leopards and domestic cats.
Each branch or clade can be nested within larger clades. • A clade consists of an ancestral species and all its descendents, a monophyletic group. • Groups that do not fit this definition are unacceptable in cladistics.
Determining which similarities between species are relevant to grouping the species in a clade is a challenge. • It is especially important to distinguish similarities that are based on shared ancestry or homology from those that are based on convergent evolution or analogy.
As a general rule, the more homologous parts that two species share, the more closely related they are. • Adaptation can obscure homology and convergence can create misleading analogies. • Also, the more complex two structures are, the less likely that they evolved independently. • For example, the skulls of a human and chimpanzee are composed not of a single bone, but a fusion of multiple bones that match almost perfectly. • It is highly improbable that such complex structures matching in so many details could have separate origins.
For example, the forelimbs of bats and birds are analogous adaptations for flight because the fossil record shows that both evolved independently from the walking forelimbs of different ancestors. • Their common specializations for flight are convergent, not indications of recent common ancestry. • The presence of forelimbs in both birds and bats is homologous, though, at a higher level of the cladogram, at the level of tetrapods. • The question of homology versus analogy often depends on the level of the clade that is being examined.
Systematists must sort through homologous features or characters to separate shared derived characters from shared primitive characters. • A shared derived character is unique to a particular clade. • A shared primitive character is found not only in the clade being analyzed, but older clades too. • Shared derived characters are useful in establishing a phylogeny, but shared primitive characters are not.
For example, the presence of hair is a good character to distinguish the clade of mammals from other tetrapods. • It is a shared derived character that uniquely identifies mammals. • However, the presence of a backbone can qualify as a shared derived character, but at a deeper branch point that distinguishes all vertebrates from other animals. • Among vertebrates, the backbone is a shared primitive character because it evolved in the ancestor common to all vertebrates.
A key step in cladistic analysis is outgroup comparison which is used to differentiate shared primitive characters from shared derived ones. • To do this we need to identify an outgroup: • a species or group of species that is closely related to the species that we are studying, • but known to be less closely related than any study-group members are to each other.
In an outgroup analysis, the assumption is that any homologies shared by the ingroup and outgroup must be primitive characters already present in the ancestor common to both groups. • Homologies present in some or all of the ingroup taxa must have evolved after the divergence of the ingroup and outgroup taxa.
Analyzing the taxonomic distribution of homologies enables us to identify the sequence in which derived characters evolved during vertebrate phylogeny.
Systematists can use cladograms to place species in the taxonomic hierarchy. • For example, using turtles as the outgroup, we can assign increasing exclusive clades to finer levels of the hierarchy of taxa.
Parsimony is used to reconstruct phylogeny • The process of converting data into phylogenetic trees can be daunting problem. • If we wish to determine the relationships among four species or taxa, we would need to choose among several potential trees.
As we consider more and more taxa, the number of possible trees increases dramatically. • There are about 3 x 1076 possible phylogenetic trees for a group of 50 species. • Even computer analyses of these data sets can take too long to search for the tree that best fits the data.
Systematists use the principle of parsimony to choose among the many possible trees to find the tree that best fits the data. • The principle of parsimony states that a theory about nature should be the simplest explanation that is consistent with the facts.
In phylogenetic analysis, parsimony is used to justify the choice of a tree that represents the smallest number of evolutionary changes. • As an example, if we wanted to use the DNA sequences from seven sites to determine the most parsimonious arrangement of fourspecies, we wouldbegin by tabulatingthe sequence data. • Then, we woulddraw all possible phylogenies forthe four species,including thethree shown here.
We would trace the number of events (mutations) necessary on each tree to produce the data in our DNA table. • After all the DNAsites have been added to each tree we add up the total events for each tree and determine which tree required the fewest changes, the most parsimonious tree.
Phylogenetic trees are hypotheses • The rationale for using parsimony as a guide to our choice among many possible trees is that for any species’ characters, hereditary fidelity is more common than change. • At the molecular level, point mutations do occasionally change a base within a DNA sequence, but exact transmission from generation to generation is thousands of times more common than change. • Similarly, one could construct a primitive phylogeny that places humans and apes as distant clades but this would assume an unnecessarily complicated scenario.
A cladogram that is not the most parsimonious would assume an unnecessarily complicated scenario, rather than the simplest explanation. • Given a choice of possible trees we can draw for a set of species or higher taxa, the best hypothesis is the one that is the best fit for all the available data.
In the absence of conflicting information, the most parsimonious tree is the logical choice among alternative hypotheses. • A limited character set may lead to acceptance of a tree that is most parsimonious, but that is also wrong. • Therefore, it is always important to remember that any phylogenetic diagram is a hypothesis, subject to rejection or revision as more character data are available.
For example, based on the number of heart chambers, birds and mammals, both with four chambers, appear to be more closely related to each other than lizards with three chambers. • But abundant evidence indicates that birds and mammals evolved from different reptilian ancestors. • The four chambered hearts are analogous, not homologous, leading to a misleading cladogram.
Regardless of the source of data (DNA sequence, morphology, etc.), the most reliable trees are based on the largest data base. • Occasionally misjudging an analogous similarity in morphology or gene sequence as a shared derived homology is less likely to distort a phylogenetic tree if each clade in the tree is defined by several derived characters. • The strongest phylogenetic hypotheses of all are supported by both the morphological and molecular evidence.
Systematists can infer phylogeny from molecular evidence • The application of molecular methods and data for comparing species and tracing phylogenies has accelerated revision of taxonomic trees. • If homology reflects common ancestry, then comparing genes and proteins among organisms should provide insights into their evolutionary relationships. • The more recently two species have branched from a common ancestor, the more similar their DNA and amino acid sequences should be. • These data for many species are available via the internet.
Molecular systematics makes it possible to assess phylogenetic relationships that cannot be measured by comparative anatomy and other non-molecular methods. • This includes groups that are too closely related to have accumulated much morphological divergence. • At the other extreme, some groups (e.g., fungi, animals, and plants) have diverged so much that little morphological homology remains.
Most molecular systematics is based on a comparison of nucleotide sequences in DNA, or RNA. • Each nucleotide position along a stretch of DNA represents an inherited character as one of the four DNA bases: A (adenine), G (guanine), C (cytosine), and T (thymine). • Systematists may compare hundreds or thousands of adjacent nucleotide positions and among several DNA regions to assess the relationship between two species. • This DNA sequence analysis provides a quantitative tool for constructing cladograms with branch points defined by mutations in DNA sequence.
The rates of change in DNA sequences varies from one part of the genome to another. • Some regions (e.g., rRNA) that change relatively slowly are useful in investigating relationships between taxa that diverged hundreds of millions of years ago. • Other regions (e.g., mtDNA) evolve relatively rapidly and can be employed to assess the phylogeny of species that are closely related or even populations of the same species.
The replication of a DNA molecule begins at special sites, origins of replication. • In bacteria, this is a single specific sequence of nucleotides that is recognized by the replication enzymes. • These enzymes separate the strands, forming a replication “bubble”. • Replication proceeds in both directions until the entire molecule is copied.
The replication of a DNA molecule begins at origins of replication. • At the origin sites, the DNA strands separate forming a replication “bubble”. • The replication bubbles elongate as the DNA is replicated and eventually fuse.
DNA polymerases catalyze the elongation of new DNA at a replication fork. • As nucleotides align with complementary bases along the template strand, they are added to the growing end of the new strand by the polymerase. • The rate of elongation is about 500 nucleotides per second in bacteria and 50 per second in human cells.
The strands in the double helix are antiparallel. • The sugar-phosphate Backbones run in opposite directions. • Each DNA strand has a 3’ end with a free hydroxyl group attached to deoxyribose and a 5’ end with a free phosphate group attached to deoxyribose.
DNA polymerases can only add nucleotides to the free 3’ end of a growing DNA strand. • A new DNA strand can only elongate in the 5’->3’ direction. • This creates a problem at the replication fork because one parental strand is oriented 3’->5’ into the fork, while the other antiparallel parental strand is oriented 5’->3’ into the fork. • At the replication fork, one parental strand (3’-> 5’ into the fork), the leading strand, can be used by polymerases as a template for a continuous complimentary strand.
To summarize, at the replication fork, the leading stand is copied continuously into the fork from a single primer. • The lagging strand is copied away from the fork in short segments, each requiring a new primer.
The first step in DNA comparisons is to align homologous DNA sequences for the species we are comparing. • Two closely related species may differ only in which base is present at a few sites. • Less closely related species may not only differ in bases at many sites, but there may be insertions and deletions that alter the length of genes • This creates problems for establishing homology.
This phylogenetic tree is bases on nucleotide sequences from the small subunit ribosomal RNA.