Download

1 / 57
590 likes | 785 Vues
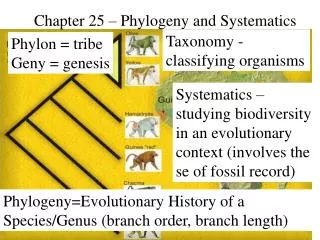
Phylogeny and Systematics. chapter 25. WARM UP: What evidence would you use to create a cladogram? STANDARDS: 8. Evolution is the result of genetic changes that occur in constantly changing environments. d. Students know reproductive or geographic isolation affects speciation.

E N D
Phylogeny and Systematics chapter 25
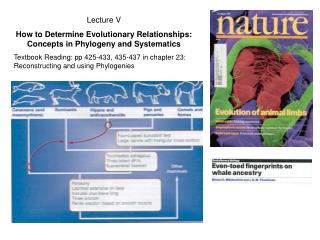
WARM UP: What evidence would you use to create a cladogram? STANDARDS: 8. Evolution is the result of genetic changes that occur in constantly changing environments. • d. Students know reproductive or geographic isolation affects speciation. • e. Students know how to analyze fossil evidence with regard to biological diversity, episodic speciation, and mass extinction. • f.* Students know how to use comparative embryology, DNA or protein sequence comparisons, and other independent sources of data to create a branching diagram (cladogram) that shows probable evolutionary relationships. • g.* Students know how several independent molecular clocks, calibrated against each other and combined with evidence from the fossil record, can help to estimate how long ago various groups of organisms diverged evolutionarily from one another.
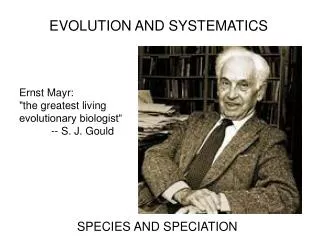
Phylogeny • Greek phylon, tribe & genesis, origin • The evolutionary history of a species or group of related species. Systematics • The study of biological diversity in an evolutionary context. • Reconstruct phylogeny. • Name and classify species. Taxonomy • The branch of biology concerned with naming and classifying diverse forms of life.
Figure 25.18 Modern systematics is shaking some phylogenetic trees
Fossil record • The ordered array in which fossils appear within layers, or strata, of sedimentary rocks that mark the passing of geologic time. Geologic time scale • Consistent sequence of historical periods based on fossils collected from many sites. • Tells the order in which groups of species present in a strata evolved but not absolute age. • 4 Eras: 1) Precambrian (4,600 mya - 543 mya) life evolves 2) Paleozoic (543 mya - 245 mya) life leaves water 3) Mesozoic (245 mya - 65 mya) reptiles 4) Cenozoic (65 mya - present) age of mammals
Radiometric dating • Measurement of certain radioactive isotopes in fossils or rocks. • Method most often used to determine the ages of rocks and fossils on scale of absolute time. 1) organism accumulates isotopes of elements while alive- stops upon death. 2) isotopes decay at a fixed rate. 3) half-life is the number of years it takes for 50% of the original sample to decay. ex. Carbon-14 / 5,730 years / Nitrogen-14 Uranium-238 / 4.5 billion years / Lead
Plate tectonics • Geologic processes resulting from plate movement • Modern continents are passengers on crustal plates that are swept across Earth’s surface by convection currents of the hot mantle below.
Figure 25.3 Earth’s crustal plates and plate tectonics (geologic processes resulting from plate movements)
Pangaea • Supercontinent “all land” • Existed 250 million years ago, near the end of the Paleozoic era • Species that had been evolving in isolation came together and competed. • Formation had tremendous environmental impact that reshaped biological diversity by causing extinctions and providing new opportunities for surviving taxonomic groups. • Began to break up 180 million years ago- divergent evolution. • ex. Australia isolated for 50 million years (marsupials)
Punctuated mass extinctions • Fossil record reveals an episodic history of: - Long, relatively quiescent periods - briefer intervals of species turnover. • Mass extinctions are followed by extensive diversification of surviving taxonomic groups. -ex. Permian Mass Extinction 250 mya 90% of marine animals (& land) perished -ex. Cretaceous Mass Extinction 65 mya more than 1/2 of all species- dinosaurs Yucatan crater • Impact Hypothesis- Walter & Luis Alvarez, UCBerkeley • Chicxulub 180 km (10 km)- asteroid/meteorite impact was enough to darken the Earth for years.
Figure 25.6 Trauma for planet Earth and its Cretaceous life Continental drift, volcanism, and asteroid impacts may have all played a role in mass extinctions.
Figure 25.5 Diversity of life and periods of mass extinction
Taxonomic System of Classification • Developed by Linnaeus in the 18th century • It is a hierarchical system placing species into broader and broader groups of organisms. • The groups include (from broad to specific) - Kingdom (keep) - Phylum (pots) - Class (clean) - Order (or) - Family (family) - Genus (gets) - Species (sick)
Recently, Domains have been added: • Archeae • Bacteria • Eukarya Linnaeus also developed a system of binomial nomenclature • All organisms are given two-part latinized name • The genus is the first name and is capitalized • the species is the second name • The names are italicized For example: Canis lupis
Eukarya Domain • Animalia Kingdom • Chordata Phylum • Mammalia Class • Carnivora Order • Canidae Family • Canis Genus • Lupis Species
Phylo-genetic trees reflect the hierarchical classification of taxonomic groups nested within more inclusive groups.
Cladistics = creating a phylogenic tree based on: • Anatomical traits that appear as dichotomies, or two-way branching points • Each branch point represents the divergence of two species from a common ancestor Various branches in a cladogram indicate a clade (from Greek clados, branch) • Consists of an ancestral species and all of its descendents • New branches or clades are designated by a shared derived character • Backbone contains the shared primitive characters
Unnumbered Figure (page 494) Cladograms Ability to pur Retractable claws
A problem with anatomical traits: convergent evolution • different species possess common characteristics because they have similar ecological roles and natural selection pressures. • Some organisms have analogous structures/ adaptations • i.e. wings of butterfly/wings of a bird are analogous flight equipment.
Molecular changes • Many organisms share similar sequences of DNA and amino acids (polypeptides) • Mutations- insertions/deletions occur over time • Databases & computer programs are used to assess phylogenetic relationships that cannot be measured by comparative anatomy or other methods. Molecular clock: using differences in the sequence of DNA and in protein amino acid sequence to place the origin of taxonomic groups in time. • Based on the observation that at least some regions of genomes evolve at constant rates. • The number of nucleotide and amino acid substitutions is proportional to the time that has elapsed since the lineages branched.
Figure 25.19 When did most major mammalian orders originate?