Download
1 / 44
440 likes | 458 Vues
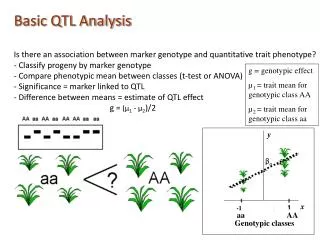
Learn how to measure and understand the genetic basis of important traits, design a selection strategy based on heritability, and monitor progress. This review and complete QTL analysis will provide guidelines for breeding and take-home messages.

E N D
Focus on the important traits Learn how to measure the traits Understand the genetic basis of the phenotype Design a selection strategy based on the heritability of the trait Monitor progress “Guidelines” for breeding – Take home Messages
Define the important traits Survey Talk to growers and end users Experience Focus on the important traits
Learn how to measure the traits • Repeatability • Maximize ability to measure genetic component • Efficient use of resources
Understand the genetics of the trait • Heritability • Number of genes and map position • (of secondary importance)
Design a selection strategy based on the heritability of the trait • High heritability • Large populations • Single plant selection • Late generation • Low heritability • Early generation selection • Replication • Family mean basis
Monitor progress • Are you improving your populations for the important traits? • Does your selection criteria match reality?
An example: overview of breeding strategy for color and lycopene in tomatoes for processing • Strategy to measure VG for color • Selection strategy for color and lycopene • Genetic basis for color • Efficiency of selection • Monitor Progress
Use the results from regional trials to learn about the repeatability of trait measurement and the heritability of the trait. OH, IN, MI, PENN, NJ
What is the biological interpretation of the estimates from the variance partition ? • Genotype (5%-29%) • Between fruit within plot (2%-15%) • Within fruit (31%)
Power test to design sampling strategy • Formula for confidence interval about a sample mean: I = 2 * t * /n1/2 • Variance of a genotype's mean is: 2G = 2gy/Y + 2gby/BY + 2f/FBY + 2e/SFBY (I/2)2 = t2*2gy/Y+z2*2gby/BY+z2*2f/FBY+z2*2e/FSBY • Solve for term (no. of fruit in this e.g.) F=[(z2/SBY)*(2e + S2fgby)] / [(I/2)2-(z2*2gby/BY-t2* 2gy/Y)] • S=samples per fruit; F = fruit number; B = plot; Y= year
So, what’s the point? We can be (and need to be) precise when measuring quantitative traits We can rationally design experiments to measure quantitative traits
What more can we learn about the genetic basis of fruit color? • An application for genetic mapping • Work within populations that favor breeding progress • AB and IBC populations • Populations of varieties • The “variety” approach is based on assumptions • the population is in linkage equilibrium • there are few alleles at each locus. • Results must be verified in segregating populations • the breeding population is small (n=36-72) • Only 25% of “linkages” were verified in study of oat quality traits
The inheritance of color in AB and IBC populations and populations of varieties raises issues that should be accounted for in our models. Issues: unbalanced data sample size Df for F test {Mj/Gk(Mj)} fixed and Random effects
Some issues can only be satisfactorily resolved with confirming generations. We may also learn more about the trait in subsequent crosses.(IBC2349 x Ohio 8245) F2 F3 F4 8245 2349
The interaction (epistasis) between genes from cultivated (chrom 4, 6, & 11) and wild species (chrom 7) of tomato produce fruit with better color and higher lycopene content. There is no single gene “fix”.
Proportion of Phenotypic variation explained by markers associated with color
Phenotypic variance explained by genotype and by marker Trait Approach %Vp Hue Genotype 5-10 L Genotype 13-24 Hue Markers 14-27 L Markers 22-41
Conclusions from color measurement: Sample size and replication are important for repeatability Color is a low to moderately heritable trait Selection strategy must therefore reflect need for replication of families Markers may help us improve efficiency of selection ogc & loci on chromosome 4, 7, 11 epistasis
The next step: Use marker data to help select parents for hybrids Select for epistatic interactions Compare to trait-based selection gain under selection efficiency time cost
Tomato Sauces, Rich in Lycopene, May Reduce Risk of Prostate Cancer Diets rich in tomato sauces appear to reduce the risk of prostate cancer, according to a Harvard Medical School study. The most likely reason appears to be tomatoes' high content of lycopene, a red carotenoid related to beta-carotene…. New Products based on lycopene?
Comparing the efficiency of selection for correlated traits: objective measurements of color and lycopene. Variance components for (one location, two years)
Relative efficiency of selection can be expressed as follows = r(gen){Hcolor/Hlycopene} Hcolor from variance components Hlycopene from variance components r(gen) Genetic covariance
Generalizations for selction strategy Heritability Selection Intensity (k) High > 0.5 Early generation, Single plant Stringent Moderate 0.2 to 0.5 Low < 0.2 Replicated family performance, Relaxed multiple generations stringency
Stingency of selection implies numbers as a percent of the population and can be expressed in standard deviation units for normally distributed data. G = (k)( p)(h2) Where G is gain under selection, H is heritability, p is the phenotypic variance of the population, and K is the selection index in standard deviation units The equation can be rearranged: (h2) = G / (k)( p) “realized heritability”
The index k takes into account the mean phenotypic value of the selected families or lines, the mean phenotypic value for the population, the standard deviation of the population (p) 2 , and the stringency of selection q/n (q is the number of selected lines and n is the population size). Expressing k in standard deviation units (based on the normal curve) means that k varies only with selection intensity. A selection coefficient can also be defined for marker or trait.
Selection Index (from Allard) Percent Directional k of population Selection 2.64 1% 0.5% 2.42 2% 1% 2.06 5% 2.5% 1.76 10% 5% 1.40 20% 10% 1.16 30% 15%
Breeding Strategies (both traditional and MAS) should be designed using all available information Heritability Stringency of selection Gain under selection Coefficient of relatedness for the population CI/2 for the population Number of alleles in a population Variation explained by QTL or marker
Are we making progress? • O9242 13.38 A • ogc/ogc C2/C2 • O9241 13.03 A • ogc/ogc C2/C2 • H9423 11.67 AB • ogc/ogc • O7983 11.59 AB • C2/C2 • PS696 9.93 B • wt/wt • OX38 9.72 B • wt/wt • O8245 9.39 B • wt/wt
How does our evaluation strategy compare to processor grades? Data for 8 varieties, 2 years, 552 loads
Monitoring Progress: Common checks over locations and years to control for environmental differences. Populations that change year to year. Commitment to presenting data in an objective manner that facilitates evaluation. Periodic re-evaluation of selection strategy for major and minor traits.
Populations that change year to year 1 (XYABCDEFGH) 2 (XYAGHIJKLMN) 3 (XYGHLNOPQRS)
Focus on the important traits Learn how to measure the traits Understand the genetic basis of the phenotype Design a selection strategy based on the heritability of the trait Monitor progress “Guidelines” for breeding – Take home Messages
Recommendations • Define goals • Which traits are most important? • What trait values do you want to see in a variety? • Set performance targets • Be realistic! • Determine optimal strategy for important traits • Find out what is known • Use data as a guide • Avoid fooling yourself • Evaluate progress
Recommendations (re-stated) • Identify and prioritize the traits that a new variety should have. • Set quantitative goals for the important traits and define the probability of success you wish to accept. • Adjust the selection criteria and population sizes to fit the high priority traits and quantitative goals. • Set a reasonable time frame for achieving goals.