Learning Curves in Laparoscopy Simulation
Learning Curves in Laparoscopy Simulation. Matthew Weiner MD, Christopher Steffes MD, and David L Bouwman MD April 19, 2008 Wayne State University School of Medicine. Simulation Literature (RCTs).

Learning Curves in Laparoscopy Simulation
E N D
Presentation Transcript
Learning Curves in Laparoscopy Simulation Matthew Weiner MD, Christopher Steffes MD, and David L Bouwman MD April 19, 2008 Wayne State University School of Medicine mjweiner@med.wayne.edu
Simulation Literature (RCTs) Surgical Simulation: A Systematic Review. Sutherland LM, Middleton PF, Anthony A, Hamdorf J, Cregan P, Scott D, Maddern GJ. Ann Surg. 2006 Mar; 243(3): 291-300. mjweiner@med.wayne.edu
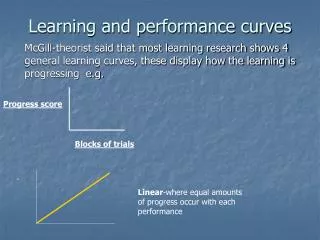
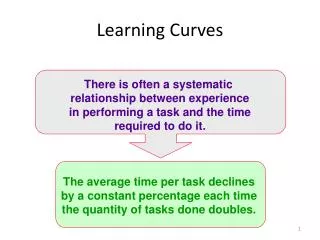
Learning Curves • Relationship between the duration of learning experience and the resulting progress • Originally described labor productivity in the aircraft industry (1936, Theodore Paul Wright) • Cumulative Average Model (Wright’s Model) • Resultant Curve is Log-Log mjweiner@med.wayne.edu
Law of Powers Y= aXb Performancetrial =Performancefinal + (Performanceinitial –Performancefinal)*(trial#)-k mjweiner@med.wayne.edu
Medical Education Technologies, Inc.™ (METI) - SurgiSim ™ mjweiner@med.wayne.edu
METI – 30 degree camera navigation mjweiner@med.wayne.edu
14 trainees • 550 sessions (15 – 165, median 17) • Performance: Time to Complete (75-388, median 124 seconds) • Universal Improvement (15-200, average 55 seconds) mjweiner@med.wayne.edu
Law of Powers Performancetrial =Performancefinal + (Performanceinitial –Performancefinal)*(trial)-k mjweiner@med.wayne.edu
Law of Powers Performancetrial =Performancefinal + (Performanceinitial –Performancefinal)*(trial)-k R2= 0.811 Performanceinitial = 170.6 sec Performancefinal= 80 sec k= 0.255 mjweiner@med.wayne.edu
Manual Skills • Fitts and Posner’s three-stage theory of motor skill acquisition • Cognitive stage: learner intellectualizes the task • Integrative stage: knowledge is translated into motor behavior • Autonomous stage: practice gradually results in smooth performance mjweiner@med.wayne.edu
Individual Data mjweiner@med.wayne.edu
Cumulative Average (Wright) • Average Time (or Cost) per Unit • Initially used to in aircraft production • Acknowledges that units are produced in “batches” • This can be applied to simulators mjweiner@med.wayne.edu
Moving Averages – Individual Data mjweiner@med.wayne.edu
Moving Averages – Individual Data mjweiner@med.wayne.edu
50% of total learning at 17.4 trials Starting performance = 182.3 s Integrative Cognitive Final performance = 128.1s Autonomous 17.4 Anatomy of a Learning Curve k d mjweiner@med.wayne.edu
Anatomy of a Learning Curve Cognitive Integrative Cognitive Integrative Autonomous Autonomous 17.4 mjweiner@med.wayne.edu
Anatomy of a Learning Curve 50% of total learning at 17.4 trials Starting performance = 182.3 s Final performance = 128.1s 50% of total learning at 25.3 trials Starting performance = 143.1 s 17.4 Final performance = 81.9 s 25.3 mjweiner@med.wayne.edu
Moving Averages – Individual Data mjweiner@med.wayne.edu
Moving Averages – Individual Data Performanceinitial = 158 sec Performancefinal= 82.0 sec Delay= 4.32 trials k= 0.06 Performanceinitial =141.0 sec Performancefinal= 86.9 sec Delay= 34.1 trials k= 0.25 Performanceinitial = 182.3 sec Performancefinal= 128.1 sec Delay= 19.1 trials k= 1.0 Performanceinitial = 135.6 sec Performancefinal= 89.7 sec Delay= 21.2 trials k= 1.0 mjweiner@med.wayne.edu
Reaching the Autonomous Stage mjweiner@med.wayne.edu
Summary • Law of Powers applies to populations, but likely not individuals • Sigmoid Curve provides a better fit for learning psychology • Performanceinitial, Performancefinal, d and k may provide additional insight into learner performance • Simulator metrics and curricular development are enhanced by evaluation over multiple trials mjweiner@med.wayne.edu