Download
1 / 33
330 likes | 475 Vues
Student Achievement Gains and Gaps in Saint Paul Public Schools . May 12, 2006. Tom Watkins Director of Research, Evaluation and Assessment Saint Paul Public Schools. Purpose of Presentation.

E N D
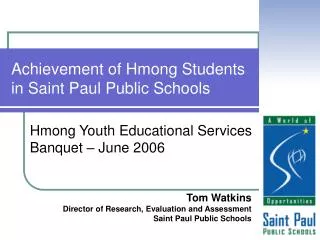
Student Achievement Gains and Gaps in Saint Paul Public Schools May 12, 2006 Tom Watkins Director of Research, Evaluation and Assessment Saint Paul Public Schools
Purpose of Presentation Provide a summary of SPPS student achievement on tests and other performance measures over the past 7 years.
Overview of Demographics Changes among the three largest demographic groups in SPPS over the past 7 years: • Stability in total number of Asian-American students, who are primarily limited English Proficient (LEP) and receive Free or Reduced Price Lunch (FRL). However, there is an increased proportion of Asian-American students who are immigrant. • Significant decline in Caucasian students who are primarily non-LEP and do not receive FRL • Significant increase in African-American students who are non-LEP and receive FRL.
Change in Gaps on the Minnesota Comprehensive Assessment • Reading, Math and Writing – change in percent of students proficient (Level III or Above) • Gaps for Grades 3 & 5 averaged together • Gaps for Grades 7 & 10/11 averaged together
Summary of Apples to Apples Comparisons on the MCA • Compares students in SPPS with their Minnesota peers • Matching students on: • Ethnicity • Free/Reduced Lunch Eligibility • ELL Status • Special Education students excluded • Groups with 100 or more students tested per grade
Change in Performance on the SAT10 and Basic Skills Tests • SAT10 Reading, Mathematics and Science • Basic Skills Test – Reading and Mathematics
ELL – All Tests FRL – All but 1 MCA math & SAT10 Sci, Non-ELL MCA below MN peers Special Education – BST Read AsianAmerican – All but Grd 10 MCA Writing American Indian – Elem MCA, SAT10 Math, BST Rd African American – MCA Mid, HS Math, BST, SAT10 Hispanic - Grd 10 Wri, BST Rd, SAT10 Math, MCA above MN peers Special Education – All MCA’s but Grd 10 Wri, SAT10 Read, Sci American Indian – Mid, HS MCA, SAT10 Rd, Sci Hispanic – Elem MCA, Mid,HS Math, SAT10 Sci African American – MCA below MN peers MCA, SAT10 and BST GAINS GAPS
Other Outcomes • NCLB Graduation Rate • Four Year Completion Rate • Dropout Rate • Honors Course Participation • AP and ACT Results
Advanced Placement (AP) Test participation has been stable over the past four years overall and for most groups.
In AP test performance, there have been increases over the past four years for Caucasian and Hispanic students, but significant decreases for Asian-American and African-American Students
ACT participation has generally increased for Asian-American and African-American students, but has decreased for Caucasian and Hispanic students
There are still significant achievement gaps between Caucasian and students of color on the ACT Assessment
ELL – Grad Rate, 4 yr Completion, Honors, Dropouts FRL – Grad Rate, 4 yr Completion, Dropouts Asian American – Grad Rate, 4 yr Completion, Dropouts & Honors African American – Grad Rate, 4 yr Completion & Dropouts Hispanic – Dropouts, Honors, AP American Indian – All measures except Dropouts Special Education – All measures except Dropouts Asian American – AP & ACT African American – AP & ACT Hispanic – Grad Rate, 4 yr Completion, ACT Grad Rate, 4 Yr Completion, Honors, AP, ACT GAINS GAPS