Download

1 / 40
400 likes | 558 Vues
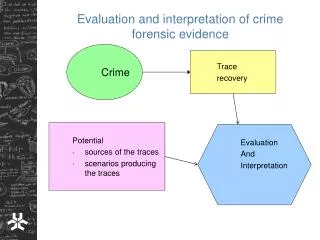
Interpretation of laboratory and epidemiological evidence. Yvan Hutin and Aftab Jasir. Conducting a collaborative epidemiology- laboratory investigation. Formulating the objectives. Drawing conclusions. Planning. Analysing. Data analysis. Lab analysis. Data. Specimens. Preparing.

E N D
Interpretation of laboratory and epidemiological evidence Yvan Hutin and Aftab Jasir
Conducting a collaborative epidemiology-laboratory investigation Formulating the objectives Drawing conclusions Planning Analysing Data analysis Lab analysis Data Specimens Preparing Collecting Instruments Sampling strategy Data Specimens When faced with the need to interpret evidence, bear in mind why the investigation was conduced
Dictionary definition of the verb: Interpret “Explain the meaning of…”
Description and interpretation in neurophysiology • Occipital cortex, visual zone: • I see concentric circles • Pre-visual zone: • This is a TARGET!
Description and interpretation in a relationship Description Interpretation S/he is angry S/he is shy S/he is too in love There is someone else I said something wrong S/he lost my number I was too insistent The parents disagree Horoscopes do not match • S/he did not call back Probably not enough data to conclude….
Situation Description Interpretation Chest X-ray • Alveolar opacity • Systematized, lobar opacity • Consolidation (Pneumonia?) Dermatology • Copper papules • Soles and palms • Desquamation • Secondary syphilis Description and interpretation in clinical practice
Language and interpretation (1) Describe and (2) interpret: What is this? Pay attention to the language you used • If you used the word “ear” you make it a rabbit • If you used the word “beak”, you make it a duck Jastrow
Interpretation of descriptive epidemiological data to generatehypotheses Narrow epidemic curve Time Hypothesis:The public tap was contaminated for a brief duration and caused the outbreak Cluster of cases @ public tap Place Case patients used the tap Person
Interpretation of analytical epidemiological data and additional investigations to testan hypothesis Strong association water drinking / illness OR Epidemiological evidence supported the hypothesis of the tap as the source of the outbreak High attributable fraction AFP Water positive for S. Typhi Wateranalysis Sewage contaminated the tap with S. Typhi and caused the outbreak X-contamination sewage / water supply Sanitaryassessment
Elements to consider before interpreting association as causation • Chance • Bias • Confounding factor • Causation • Strength of the association • Dose response • Consistency • Biological plausibility • Exposure/ outcome sequence
Casting the net and pulling it up Descriptiveepidemiological data generates hypotheses Analyticalepidemiological data tests hypotheses Can you guess why two different fishermen?
Language used for data description and data interpretation Description: Results Interpretation: Discussion The shape of the epidemic curve suggested a point source outbreak We suspected that tower A was the source of outbreak Unstable transmission does not lead to population immunity Access to health care may increase the risk of illness • Cases started to occur at 5AM, peaked at 7AM and decreased with a last case at 10AM • Cases clustered around cooling tower A • Malaria rates were high in all age groups • Cases were more likely than controls to lack health insurance
Interpretation of data in a discussion section of a paper + =
Example of integration of various pieces of evidence into an interpretation • Outbreak of cutaneous anthrax • Beef slaughter in West Bengal, India • Cohort study • Contact with meat is a risk factor • Null hypothesis: • Eating meat does not cause cutaneous anthrax
Exposures AR in exposed (%) AR in unexposed (%) Association RR 95% CI Age > 20 18 11 1.6 0.9-3 Female sex 17 14 1.2 0.7-2 Slaughter 83 9 8.7 6-13 Handling 26 10 2.6 2-4 Carry skins 100 15 6.7 5- 9 Eating 17 0 Undefined Attack rate of anthrax by exposures, Sarkarpara, Murshidabad, WB, India, 2007 All case-patients who had eaten meat had also other exposures
Other elements of evidence beyond epidemiological data • Elements available before the outbreak • Heat inactivate spores • Infected meat causes intestinal disease • Meat involved in intestinal outbreakswas poorly cooked (e.g., Kebabs) • Elements from the outbreak investigation • The beef meat was boiled
Testing the hypothesis that eating meat could cause cutaneous anthrax + =
Always consider other hypotheses • Avoid: • We found that… • This could be due to... [this real phenomenon] • Prefer: • The results are … • Two possibilities • This could be due to this real phenomenon • This could be an artifact of the study • Examine both options • See what the data support and conclude
Dealing with an un-expected finding • One unexpected exposure is associated with outcome • Absence of context • No other studies • No biological rationale • Treat as a hypothesis generation: • This association should be examined in other studies • Do not force an explanation/ rationalization • “This may be due to…”
Risk factors for post-traumatic stress disorder (PTSD), Indian Tsunami, 2005 • Unexpected effect modification: • Single woman more PTSD than married • This may be due to the fact that they are alone… • Coding error: It’s the converse that is true! • Married women have more PTSD • This may be due to the fact that they have to deal with their whole family… • Do not force interpretations • Propose further studies to look into it
Take home message • Interpretation has a subjective component • Requires a careful, documented approach • We raise hypotheses with descriptive epidemiology and test them with analytical epidemiology • Findings acquire a meaning in the context of what was known before
Conducting a collaborative epidemiology-laboratory investigation Formulating the objectives Drawing conclusions Planning Analysing Data analysis Lab analysis Data Specimens Preparing Collecting Instruments Sampling strategy Data Specimens When faced with the need to interpret evidence, bear in mind why the investigation was conduced
Possible objectives of joint laboratory epidemiology investigations • Test a hypothesis (Qualitative outcome) • Test a hypothesis • About an etiologic agent(e.g., Is West Nile virus the cause of the outbreak?) • About the relatedness of isolates(e.g., Are the cases caused by an identical pathogen?) • Measure a quantity (Quantitative outcome) • Estimate a quantity • Prevalence • Incidence
Using laboratory evidence to confirm a diagnosis during an outbreak • Short list potential etiologic agents (Hypothesis generating) according to: • Epidemiological characteristics • Clinical characteristics • Setting • Test for agents short listed (Hypothesis testing) • Positive test • Negative test • Use predictive values positive and negatives
Case scenario 1Viral Hemorrhagic Fever (VHF) • Fever • Bleeding disorders • Progress to high fever • Shock • High case fatality
Virus families causing VHF sensitive or specific?Short listing? Diverse group of animal and human illnesses that may be caused by five distinct families of RNA viruses • Arenaviridae, (Lymphocytic choriomeningitis virus, Lassa virus, Argentine, Bolivian, Brazilian and Venezuelan hemorrhagic fevers viruses) • Filoviridae (Ebola virus and Marburg virus) • Bunyaviridae (Hantaviruses, Crimean-Congo hemorrhagic fever) • Flaviviridae (dengue, yellow fever, WNV) • Rhabdoviridae (Lyssavirus)
Interpreting positive tests results during an outbreak • Use the predictive value positive that depends upon: • The frequency of the disease • The specificity of the test +++ • Elements that support the hypothesis of a true positive • The disease is frequent (GAS) • The test is specific ( emm typing) • Elements that support the hypothesis of a false positive • The disease is rare (WNV) • The test is not sufficiently specific (CFT)
Interpreting negative tests results during an outbreak • Use the predictive value negative that depends upon: • The frequency of the disease • The sensitivity of the test +++ • Elements that support the hypothesis of a true negative • The disease is rare (WNV) • The test is sensitive (IgM ELISA) • Elements that support the hypothesis of a false negative • The disease (condition) is common (GAS, Q fever) • The test is not sufficiently sensitive(Gram staining/PCR)
A test was negative only for the pathogens that were looked for • If the culture on a specific medium was not done, the test cannot be interpreted as negative for the specific pathogen • If you did not ask for Campylobacter culture, the “negative” stool culture is not really “negative” for Campylobacter
Host-pathogen relationship • Presence of an organism may have different interpretation according to the context • Immune system • Immunocompetent patient • Opportunistic pathogens may be innocent • Immunocompromised patient • Opportunistic pathogens may be the cause of the infection • Age (pertussis) • Physiological status (e.g., Urinary infection in pregnancy)
Possible objectives of joint laboratory epidemiology investigations • Test a hypothesis (Qualitative outcome) • Test a hypothesis • About an etiologic agent(e.g., Is West Nile virus the cause of the outbreak?) • About the relatedness of isolates(e.g., Are the cases caused by an identical pathogen?) • Measure a quantity (Quantitative outcome) • Estimate a quantity • Prevalence • Incidence
Using laboratory evidence to confirm the relatedness of isolates • Generate hypotheses using epidemiological evidence • Studies allowing the use of statistical tests (Large sample size) • Studies not allowing the use of statistical tests (Small sample size) • Test hypotheses using laboratory evidence • Use typing technique adapted to: • Hypothesis • Pathogen
Nosocomial IGAS infections,Skåne, Southern Sweden, 2012 • 43 cases of invasive Group A Streptococcus (iGAS) between 9 January and 29 April 2012 • 27 cases between 3 January and 24 April 2011 • Thirteen of the 43 cases in 2012 were treated in an Intensive Care Unit. One case, a 84 year old already hospitalised prior to iGAS diagnosis, died • Hospital rejects the hypothesis of nosocomial infections
Possible objectives of joint laboratory epidemiology investigations • Test a hypothesis (Qualitative outcome) • Test a hypothesis • About an etiologic agent(e.g., Is West Nile virus the cause of the outbreak?) • About the relatedness of isolates(e.g., Are the cases caused by an identical pathogen?) • Measure a quantity (Quantitative outcome) • Estimate a quantity • Prevalence • Incidence
Interpreting prevalence and incidence • A study estimating the frequency of a disease on the basis of a laboratory test (e.g., serological survey) must be interpreted according to: • Predictive value positive • Predictive value negative • These will depend upon: • The test used (sensitivity and specificity) • The frequency of the disease
Be careful about what the manufacturer may say about the predictive values • The manufacturer may report values of • Sensitivity • Specificity • These probably come from panel testing • Be careful with values of predictive values positive and negative reported by manufacturers • These values depends upon specific prevalence settings • They may come from a combination of a positive and negative panels that generate an artificial prevalence of 50%
Take home message: Interpret epidemiological and laboratory evidence as a team • Positive tests are likely to rule in the diagnosis if the test is specific and the disease is common • Negative tests are likely to rule out the diagnosis if the test is sensitive and the disease is uncommon • Emergent pathogens are discovered in the laboratory and assessed according to additional studies • Laboratory investigations of relatedness must be based on hypotheses developed on the basis of the epidemiology • Interpret incidence and prevalence indicators according to predictive values positive and negative